The table below provides basic information about the float, including primary sensors, mission parameters and current status of profiles.
| Institute | CSIRO |
| Principal Investigator | Susan Wijffels |
| Pressure Sensor | Druck (serial number=10492) |
| CTD Sensor | APEX-SBE-41 (serial number=2930) |
| CTD Sampling Mode | Burst Sampler |
| Controller Board | APF 8 |
| Additional Sensors/Software | None |
| Park Depth | 1000 m |
| Profile Depth | 2000 m |
| Launch Date | 12-05-2007 |
| Number of D-moded Profiles | 100 |
| Calibration Date | 02-08-2010 |
| Pressure Drift | Surface Pressure Offset corrected |
| Salinity Drift | No salinity drift detected |
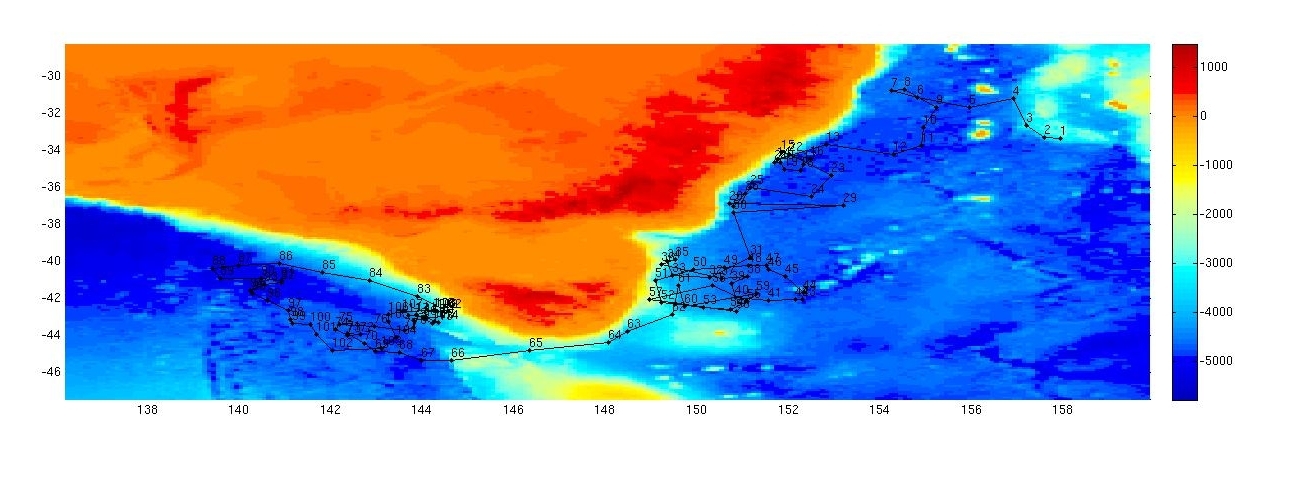
This float was deployed in the Tasman Sea to the east of NSW, in a region bounded by 149 to 158 şE and 30 to 43 şS.
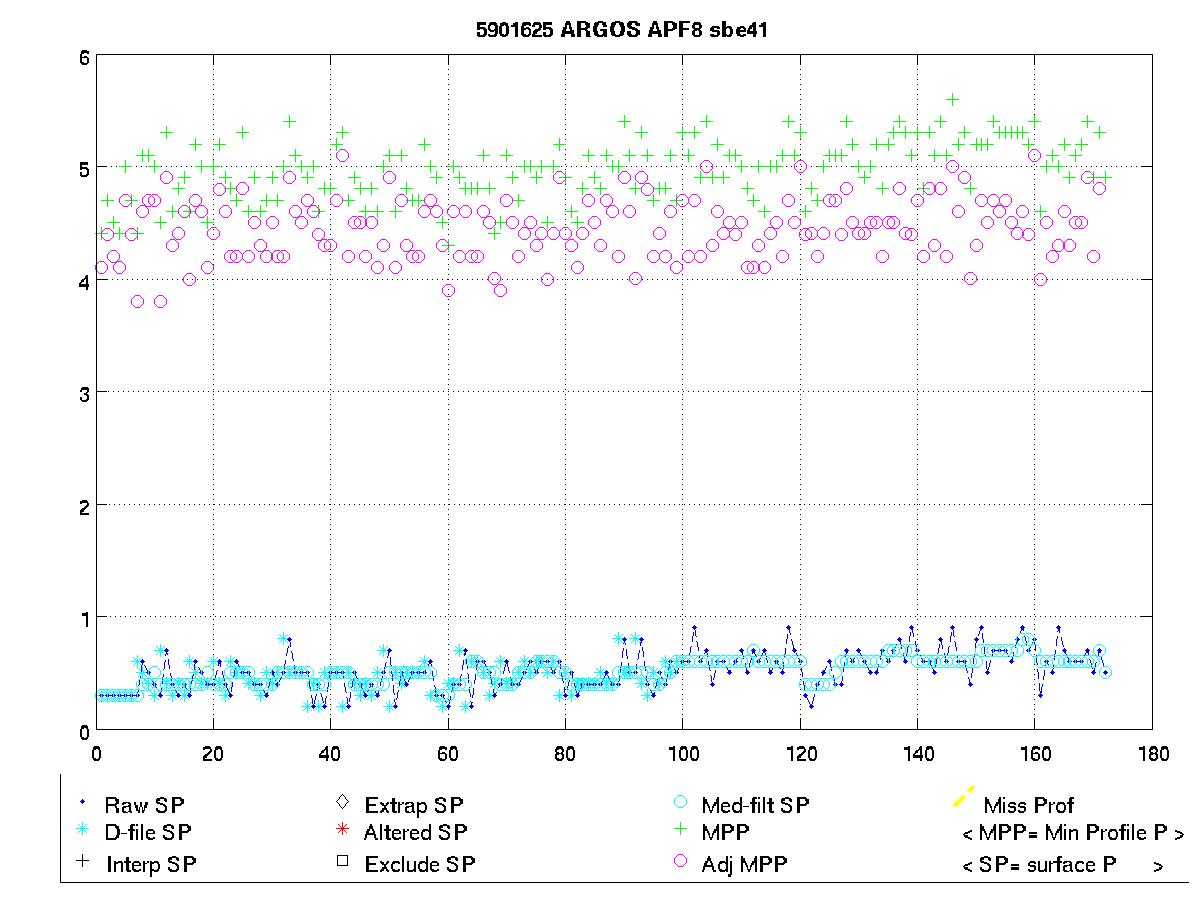
The surface pressure for this float is shown in the plot below.
Potential Temperature-Salinity (a), Location (b, Max Temperature (c) and Sea Surface Salinity (d) plots located below.
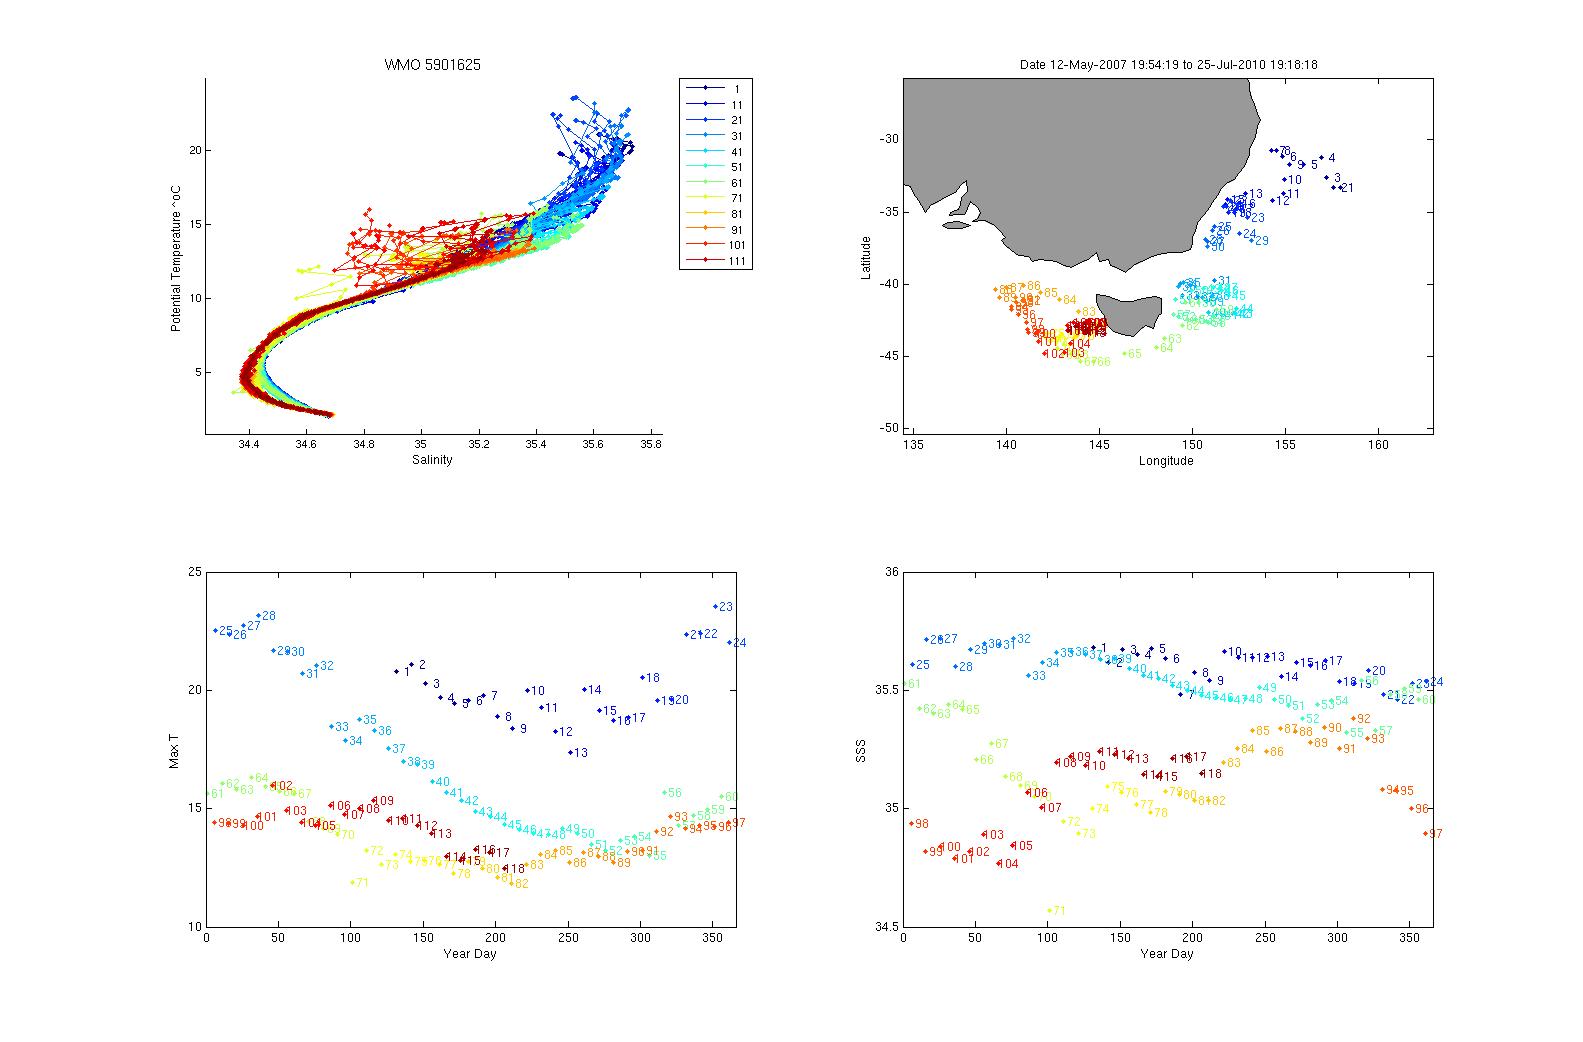
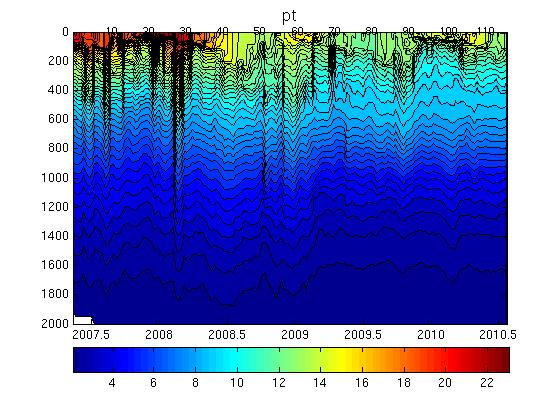
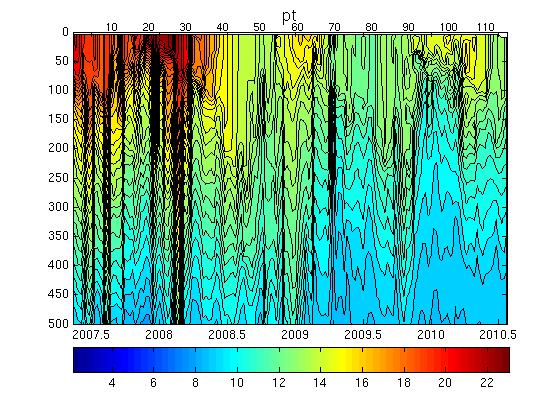
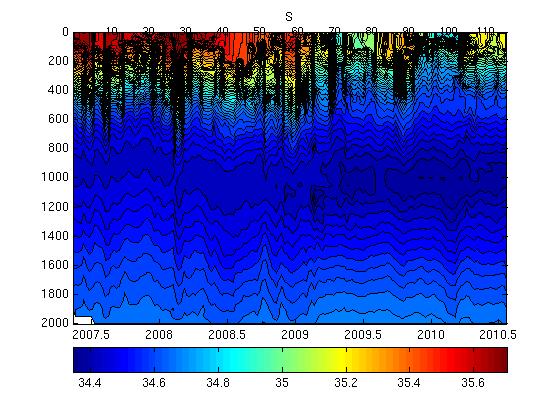
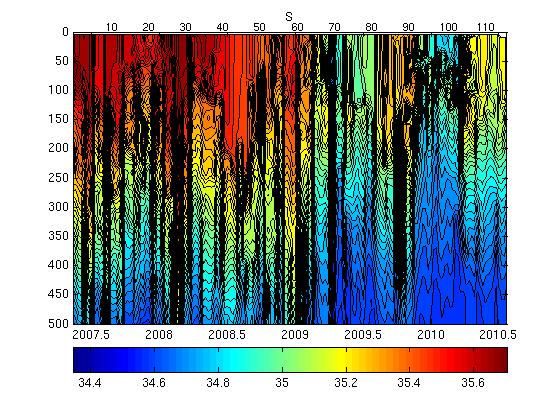
Surface temperatures generally varied between 12.5 and 25 şC and surface salinities from 35.3 to 35.75.
The plot below shows the potential-temperature/salinity relationship for the deepest theta levels where the relationship between the two parameters should show the least variation.
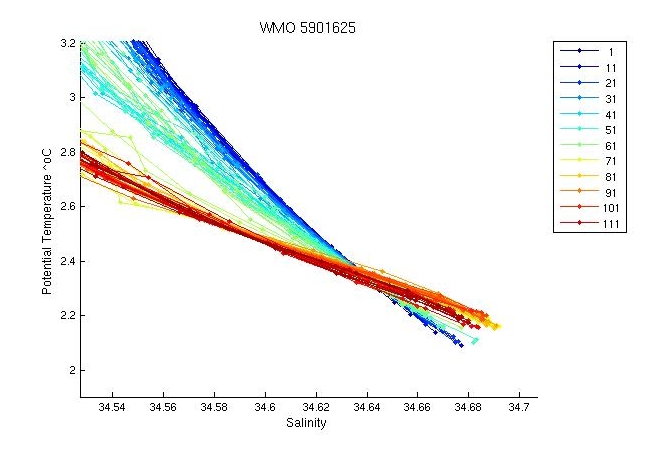
The profiles are very tightly distributed, including the deep profiles.
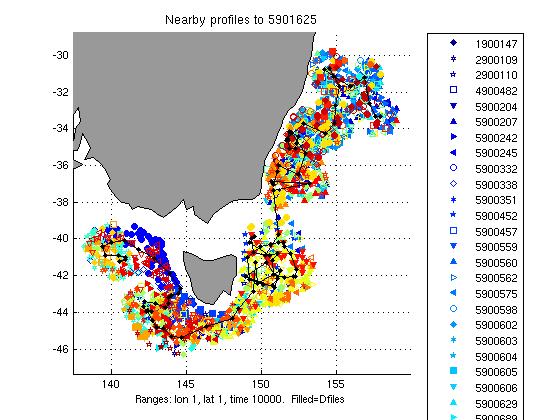
The two plots below show a). the location of this float (black circles) in relation to the position of other nearby argo floats (coloured circles) and b). The potential-temperature/salinity curve for this float (in black) compared to nearby argo floats (coloured).
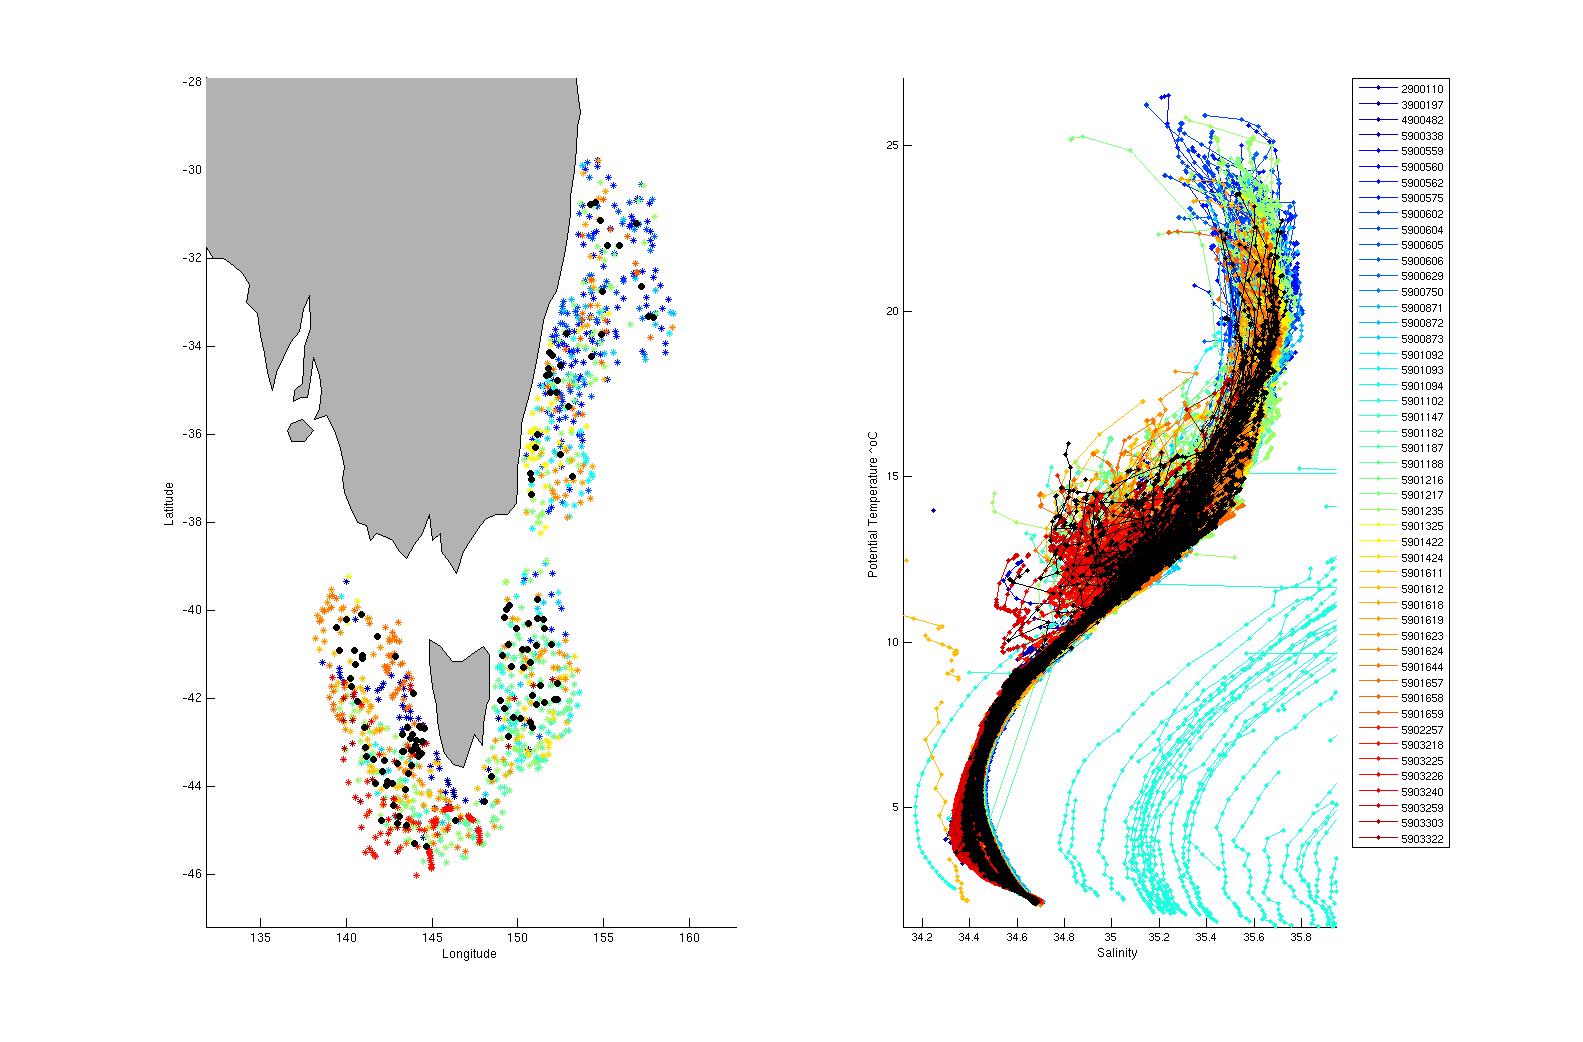
The potential-temperature/salinity relation for the deepest theta levels for this float (in black) and nearby argo floats (coloured) is displayed below.
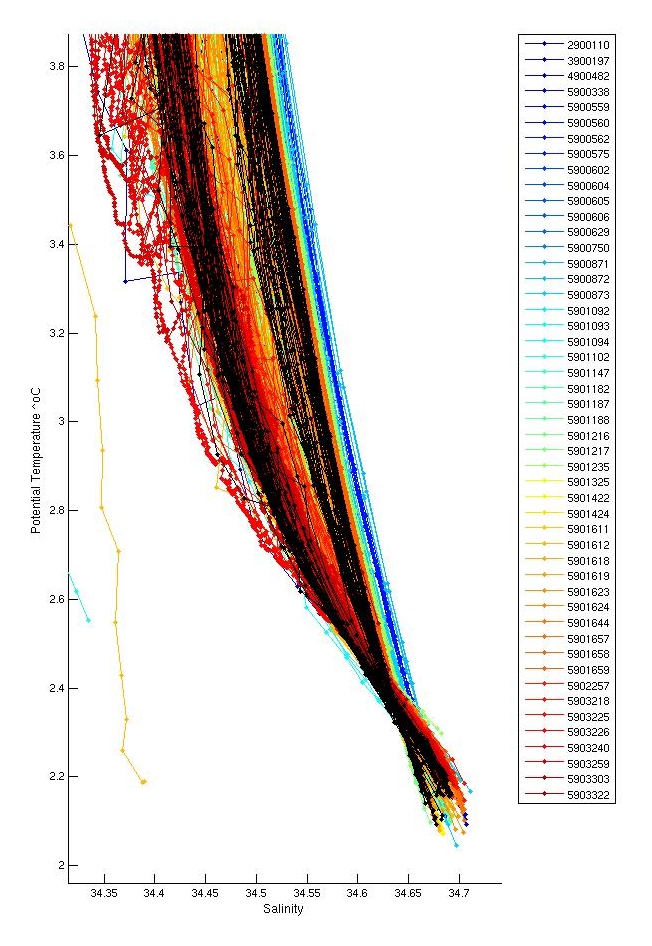
The profiles are well distributed compared to neighbouring floats. The deep profiles look comparable to neighbouring floats, although they are at the fresher end of the spectrum.
There were inversions in profiles 5 (surface, not significant), 19 (thermal lag spike, not flagged) and 37 (surface layer, not signicant) and 114.
Salt hooks were located in profiles; 3,5,9,13,15,17,19,21,23,25,30,32,37,38,40,44,48,50,52,54,55,57,59,61,63,66,68,70,73,74,79,81,83,85,87,88,90,93,95,97,99. These were flagged as QC 4 for both T & S.
There were no missing profiles. The last values of pf 36 were flagged as QC4. The position for profile 29 initially looked suspicious but is actually fine. the float was caught in an eddy and because of the ten day reporting period appears to have a spike in its trajectory when in actual fact it was simply reporting from opposing sides of the eddy!
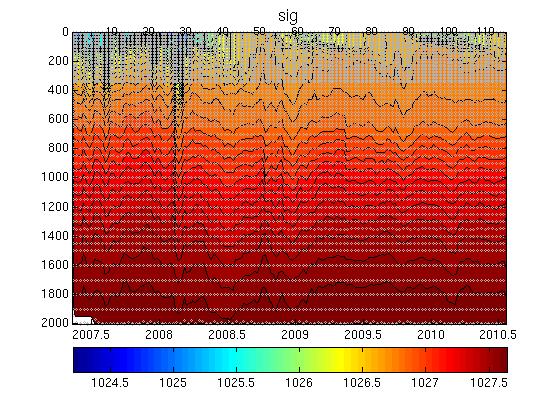
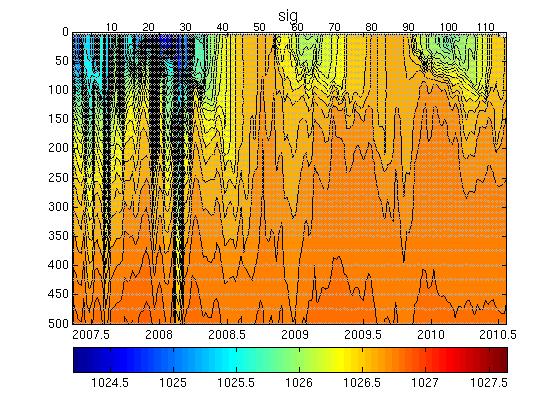
The plot below shows the analysis of salinity drift using the WJO/OW software.

This float requires no correction.
The four plots below show the salinity anomalies on theta surfaces compared to (a) the Gouretski and Kolterman climatology, (b) the CARS (CSIRO Atlas of Regional Seas)/WOA (World Ocean Atlas) climatology, (c) the anomalies within the float series itself, (i.e. the salinity anomaly of each profile from the mean profile average for the float and (d) the raw float salinity compared to the CARS and G&K climatological salinity on a theta surface of 0.xx degrees C.
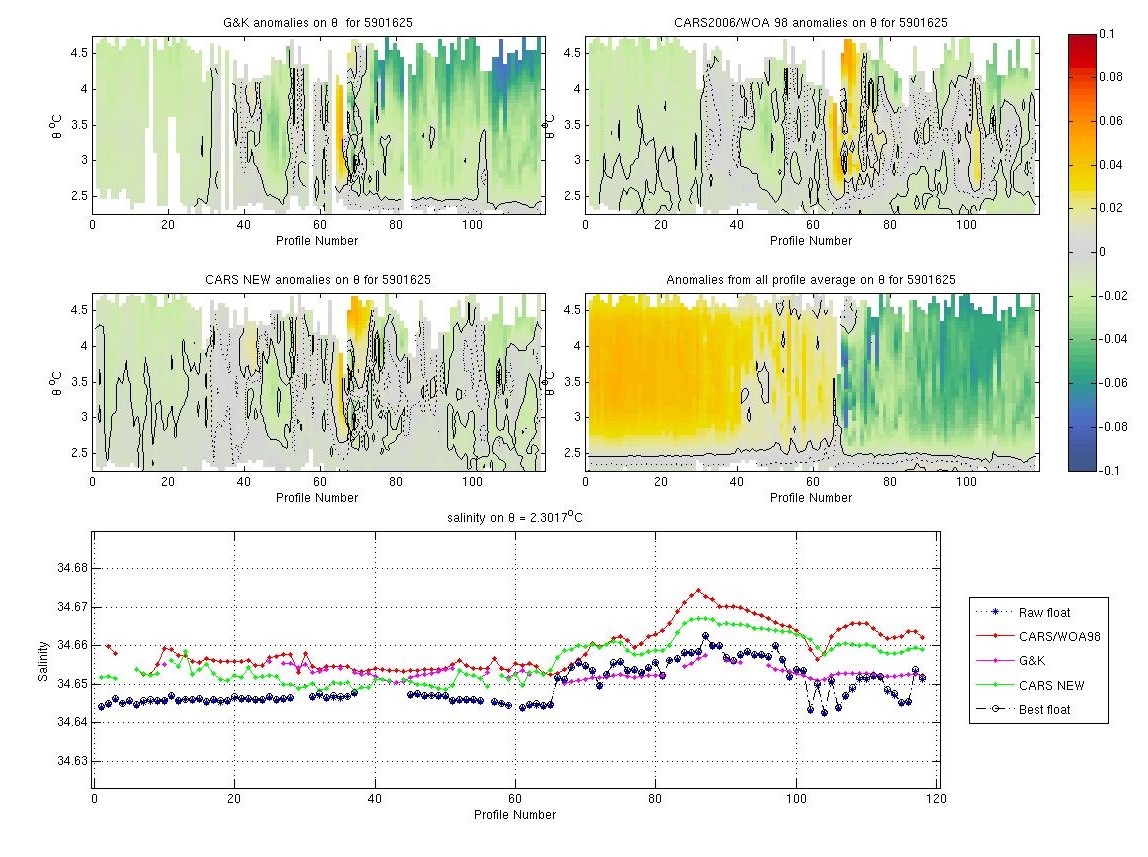
The float data is slightly fresh offset compared to climatology but comparison with nearby argo shows that this float is fine.
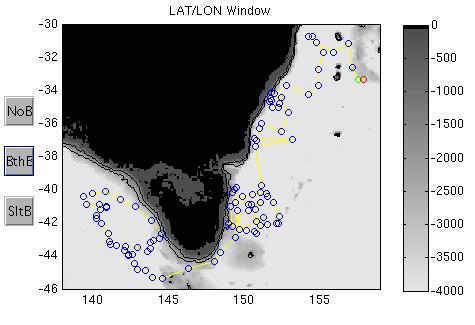
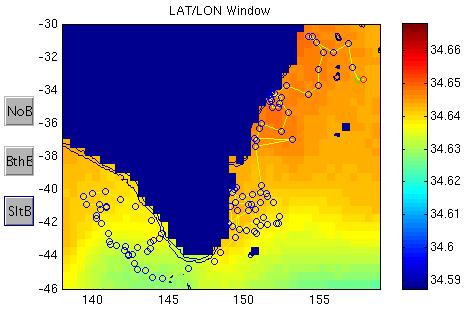
The plots below show the raw float salinity data (solid blue line) compared to neighbouring argo floats (coloured symbols) on a potential temperature surface of xx degrees C. The locality map shows the location of the profiles for this float and for neighbouring floats.
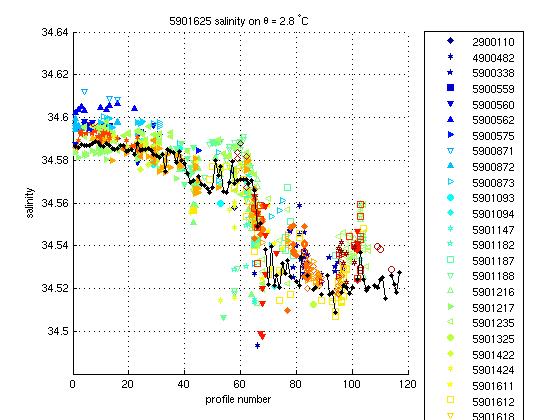
There is high variability in nearby argo floats of about +- 0.02 however this float is in the middle of the envelope and looks fine.
This float required no salinity drift correction.
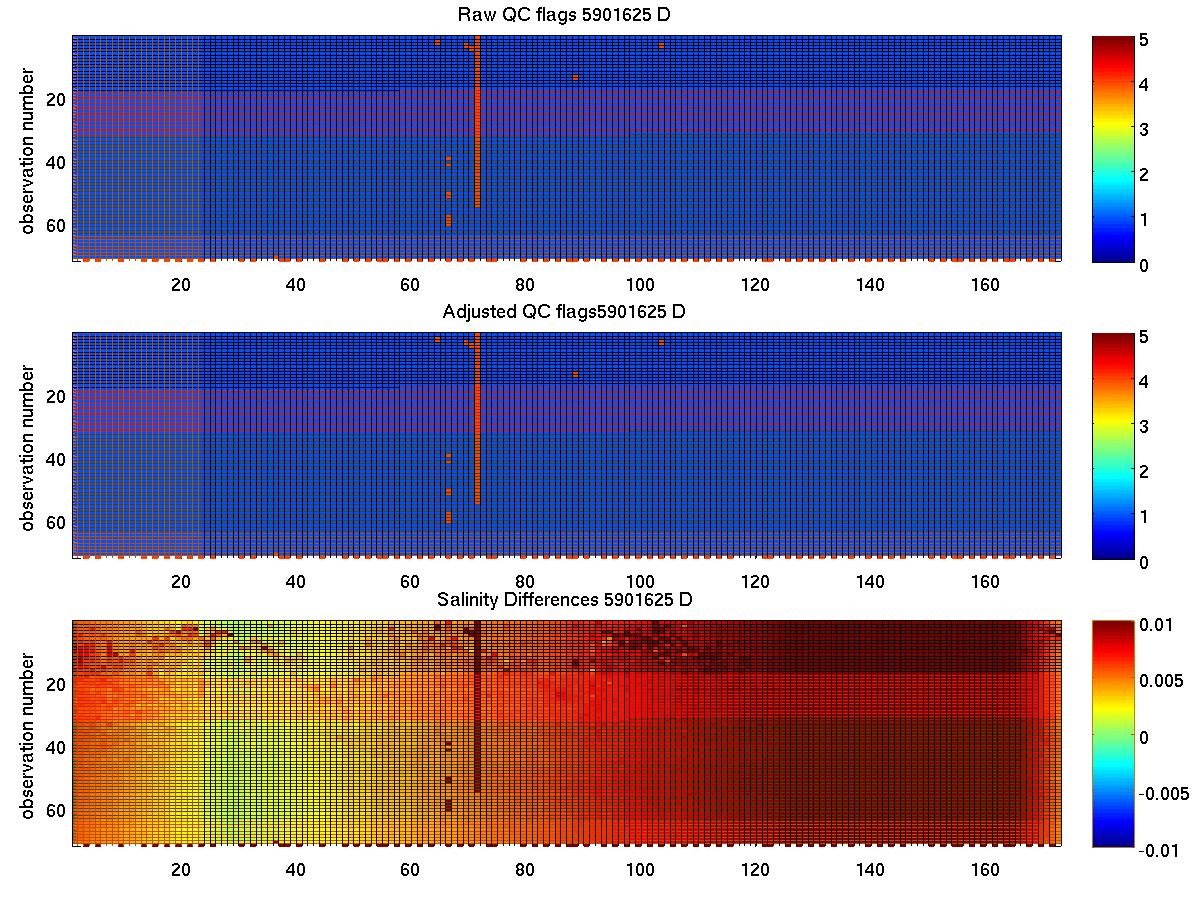
The plot below summarises the QC flags and salinity differences for the raw and adjusted salinity fields in the final delayed mode files submitted to the GDAC.
Created 03-08-2010