The table below provides basic information about the float, including primary sensors, mission parameters and current status of profiles.
| Institute | CSIRO |
| Principal Investigator | Susan Wijffels |
| Pressure Sensor | Druck (serial number=10277) |
| CTD Sensor | APEX-SBE-41 (serial number=2905) |
| CTD Sampling Mode | Burst Sampler |
| Controller Board | APF 8 |
| Additional Sensors/Software | None |
| Park Depth | 1000 m |
| Profile Depth | 2000 m |
| Launch Date | 30-04-2007 |
| Number of D-moded Profiles | 44 |
| Calibration Date | 01-03-2009 |
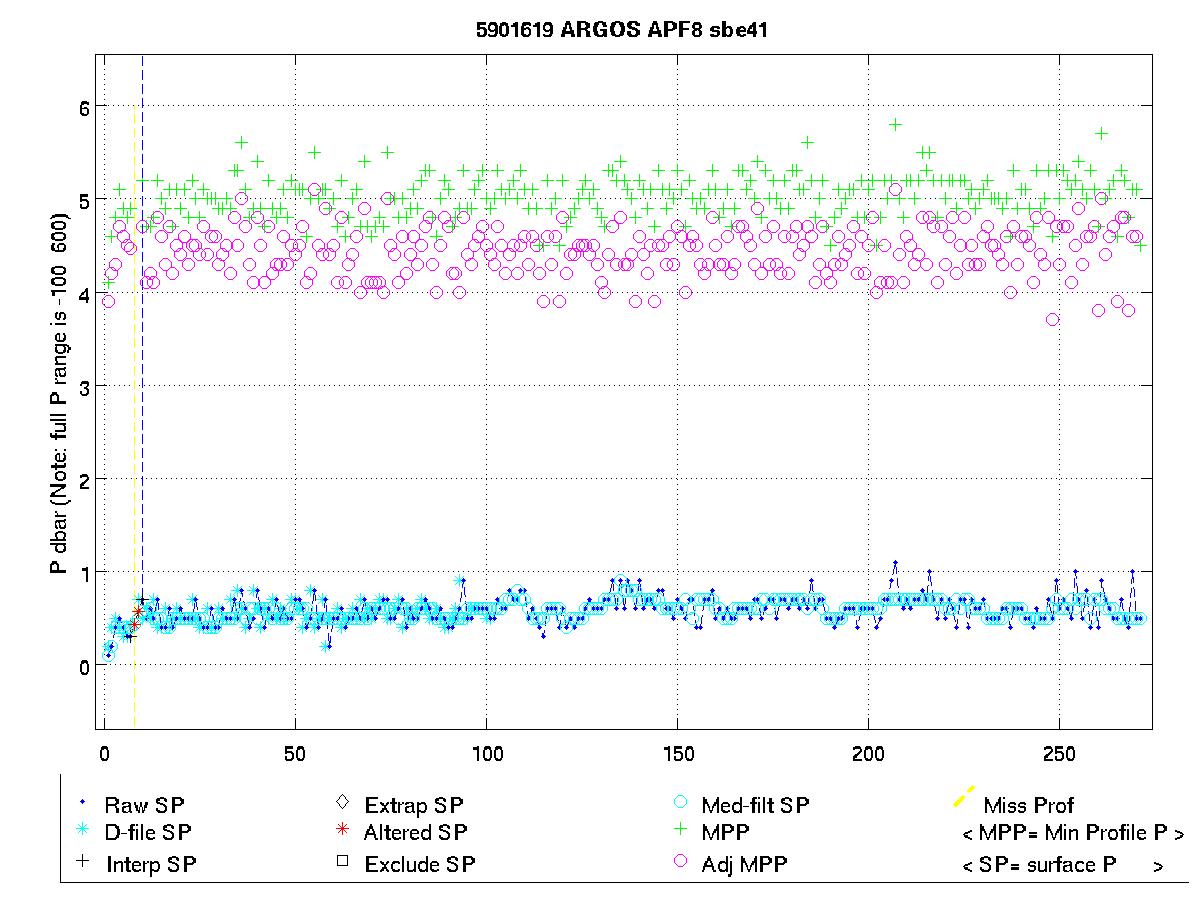
| Pressure Drift | Surface Pressure Offset corrected |
| Salinity Drift | No salinity drift detected from pf 1 to 76. CTD damaged after float grounded, pf 77 onwards qc'd as 4 |
This float was deployed in the Tasman Sea, to the east of Brisbane, in a region bounded by 153 to 160 şE and 25 to 36 şS.
The surface pressure for this float is shown in the plot below.
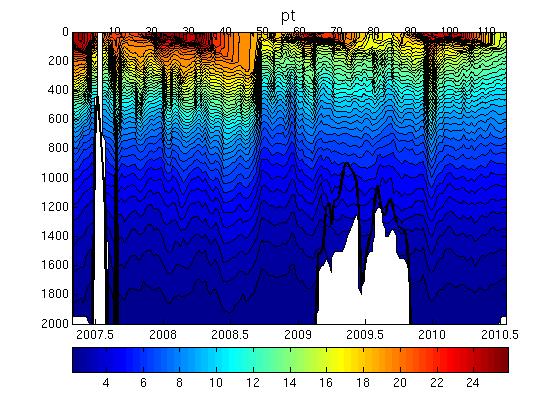
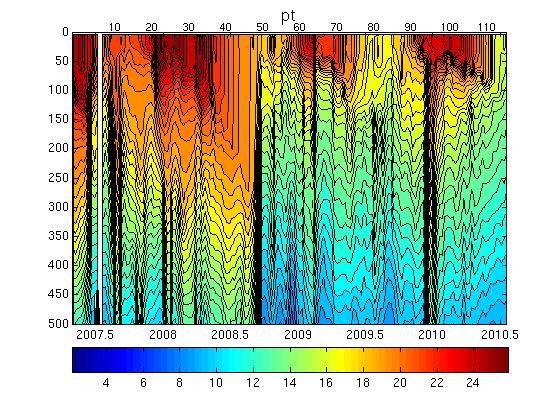
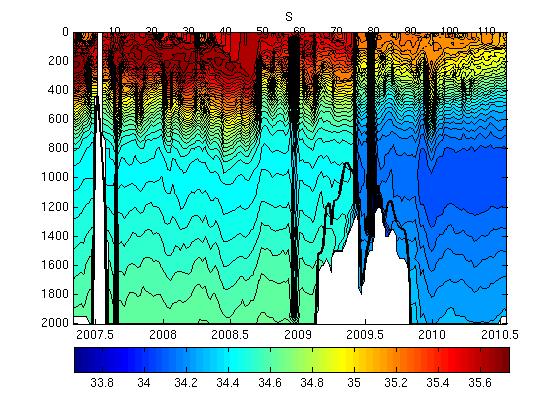
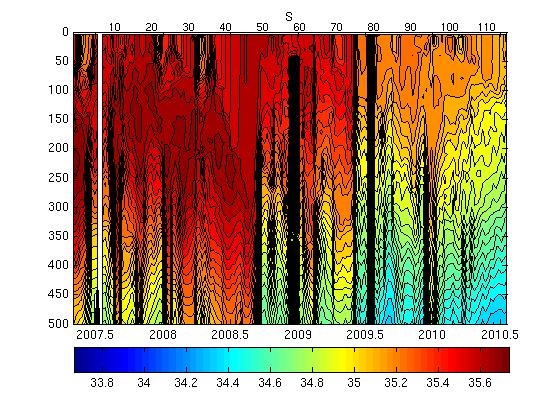
Potential Temperature-Salinity (a), Location (b, Max Temperature (c) and Sea Surface Salinity (d) plots located below.
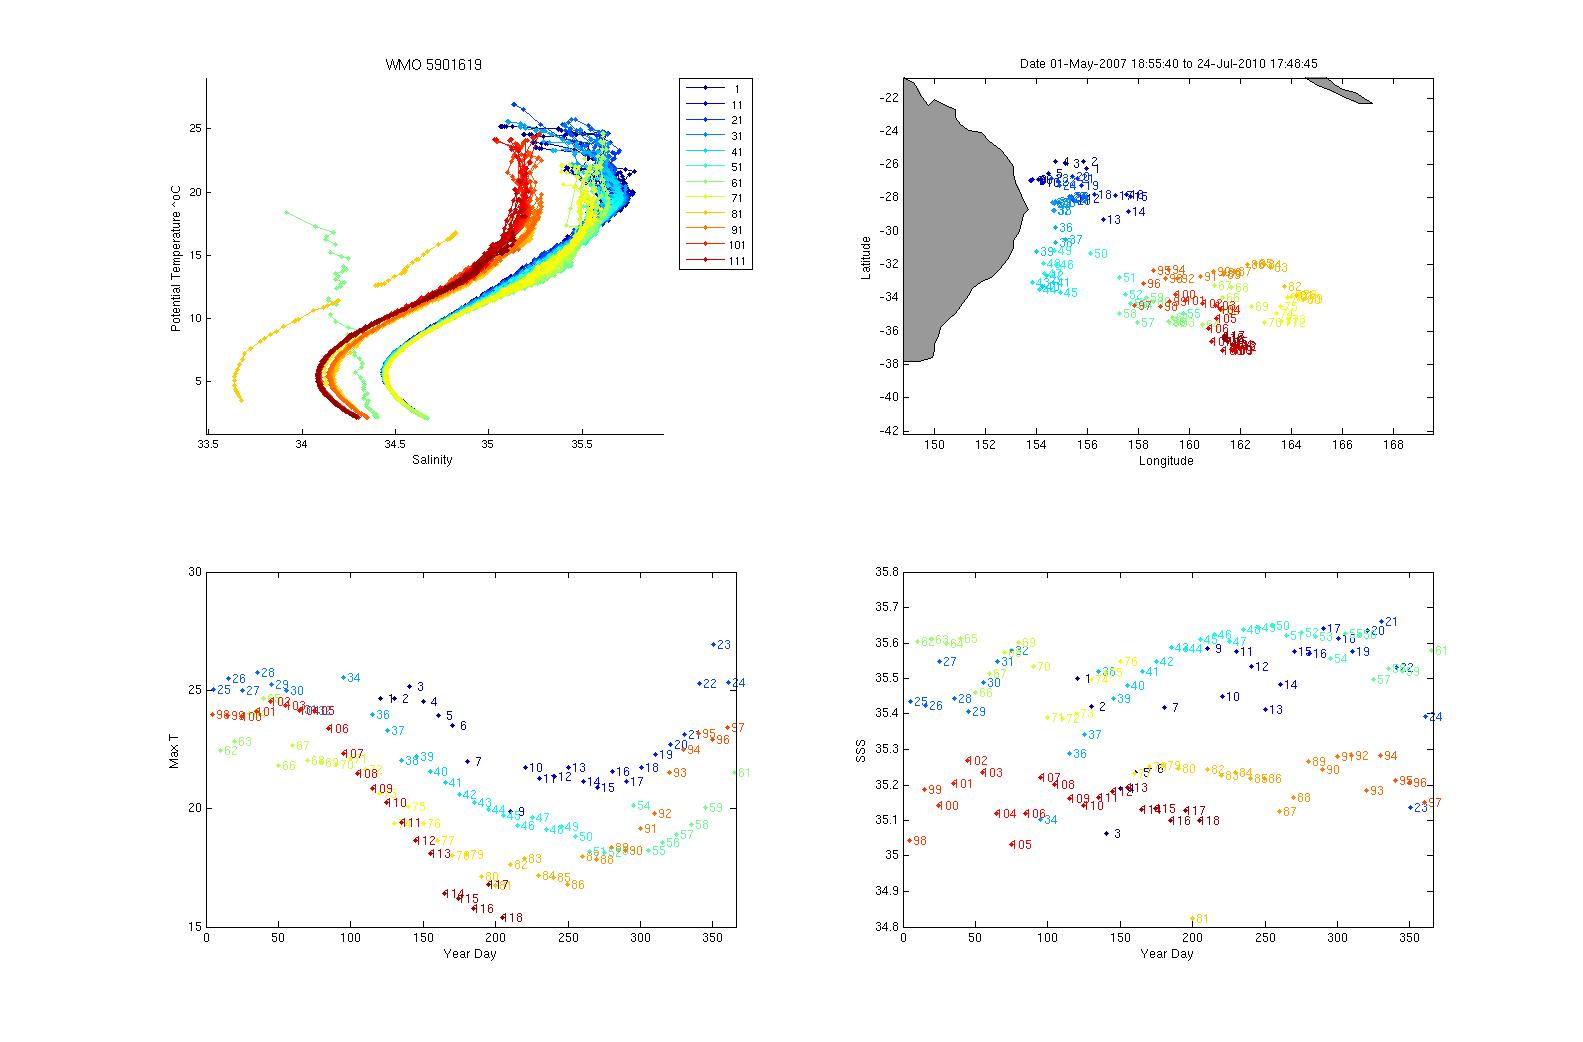
Surface temperatures generally varied between 18 and 27 şC and surface salinities from 35.0 to 35.7.
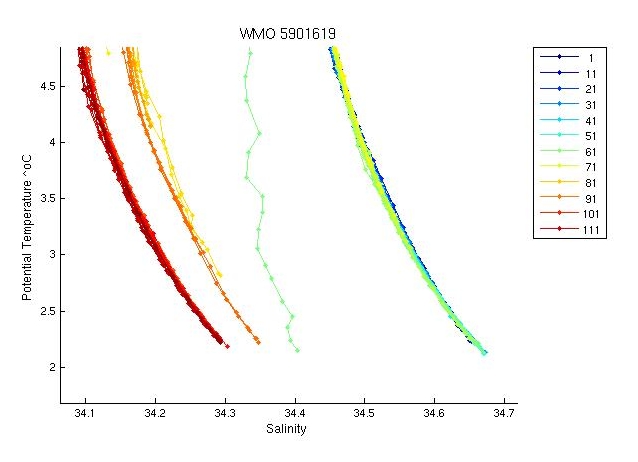
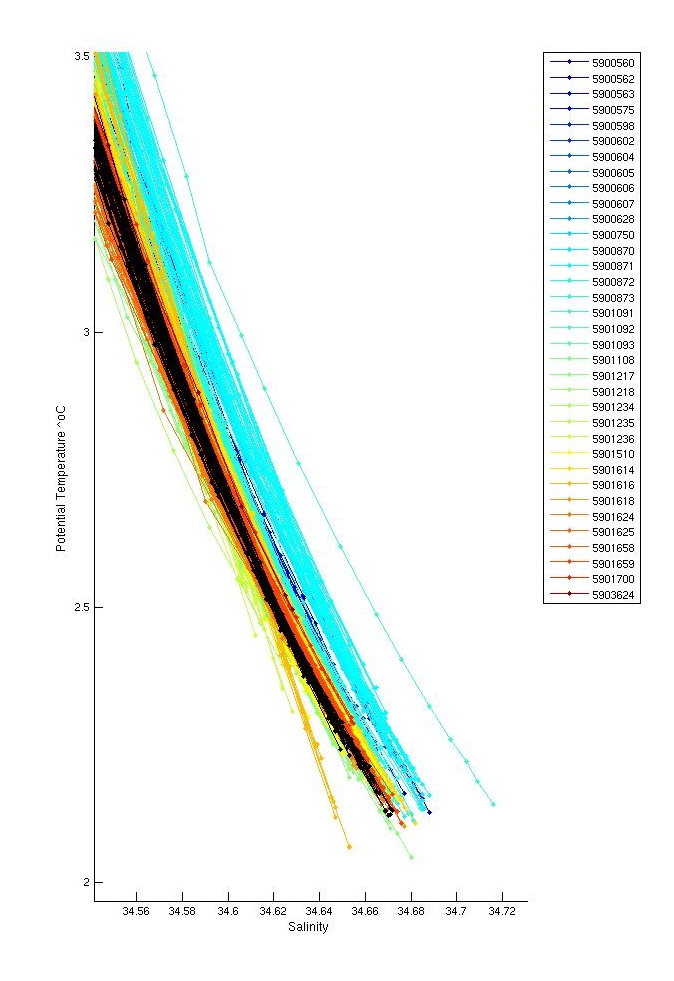
The plot below shows the potential-temperature/salinity relationship for the deepest theta levels where the relationship between the two parameters should show the least variation.
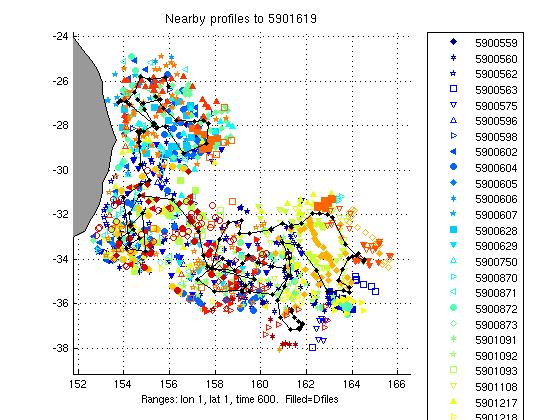
The two plots below show a). the location of this float (black circles) in relation to the position of other nearby argo floats (coloured circles) and b). The potential-temperature/salinity curve for this float (in black) compared to nearby argo floats (coloured).
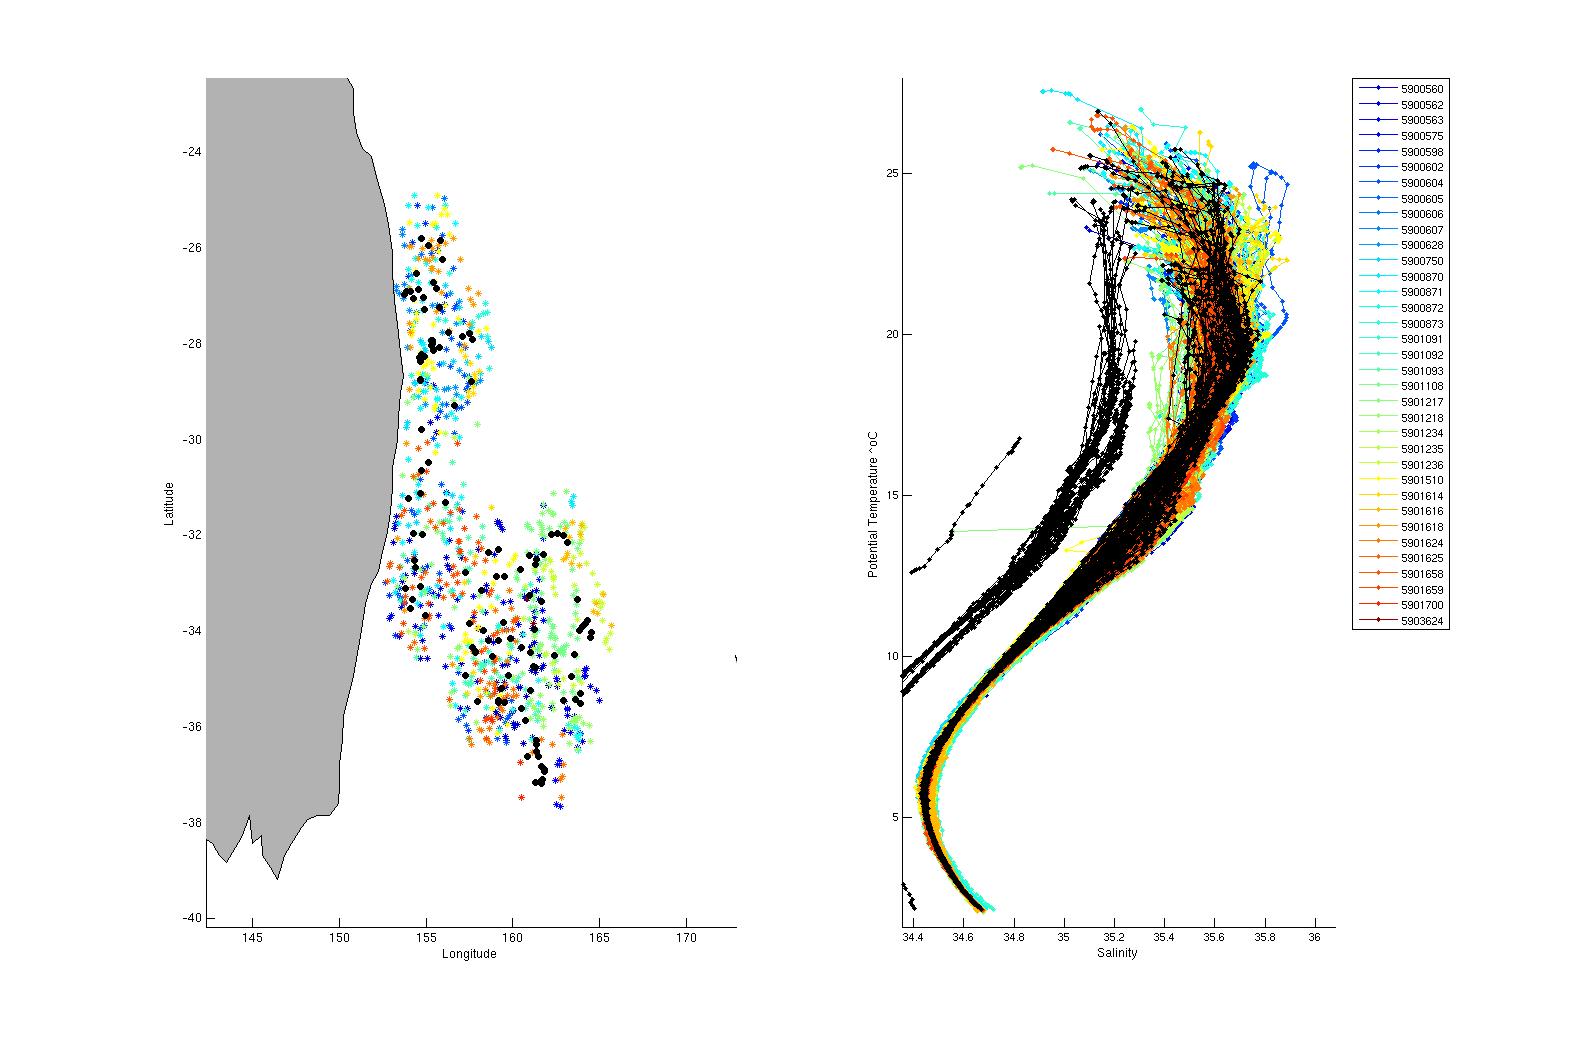
The potential-temperature/salinity relation for the deepest theta levels for this float (in black) and nearby argo floats (coloured) is displayed below.
This float is right in the middle of the profile envelope from neighbouring floats.
There were inversions in profiles; 4(surface, not significant),35(multiple inversions in the surface layer and due to thermal lag spike,these were not significant),58(at 250 m depth, not significant),82,106,110,114.
Salt hooks were located in profiles; 2,4,11,12,13,14,16,18,20,22,24,26,32,35,37,38,41,42,47,49,52,54,56,58,60,62,64,66,93,94,95,96,97,98,99,100,101. These were flagged as QC=4.
The real time software flagged all of profile 1 as bad QC and the surface values of profile 36. Both of these profiles looked fine so the QC flags were changed back to QC=4. The float grounded on profiles 7 and 8. A spike in profile 7 was flagged as QC=4. Profile 8 was all bad data, the entire profile was QC'd as 4. The last few values of profile 9 was QC'd as bad, the rest of the profile was QC'd as 3, this was the profile after the float grounded and looks slightly suspicious. It looks okay in TS space but the low salinity at depth may be indicative of gunk in the cell. User discretion as to whether you wish to include this profile in analyses.
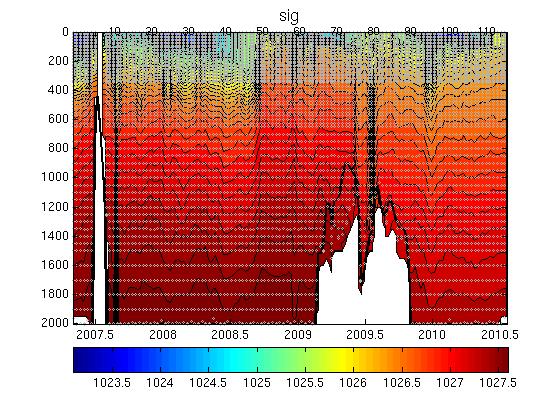
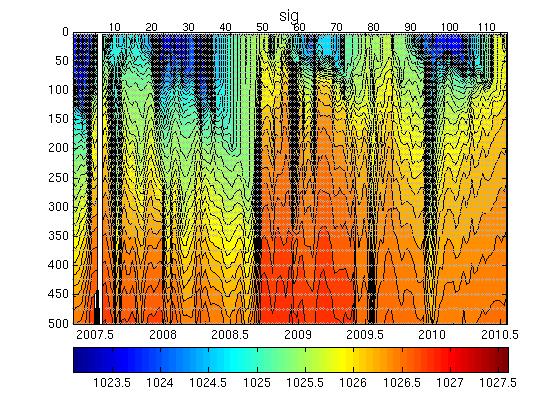
The plot below shows the analysis of salinity drift using the WJO/OW software.

This float requires no correction.
The four plots below show the salinity anomalies on theta surfaces compared to (a) the Gouretski and Kolterman climatology, (b) the CARS (CSIRO Atlas of Regional Seas)/WOA (World Ocean Atlas) climatology, (c) the anomalies within the float series itself, (i.e. the salinity anomaly of each profile from the mean profile average for the float and (d) the raw float salinity compared to the CARS and G&K climatological salinity on a deep theta surface.
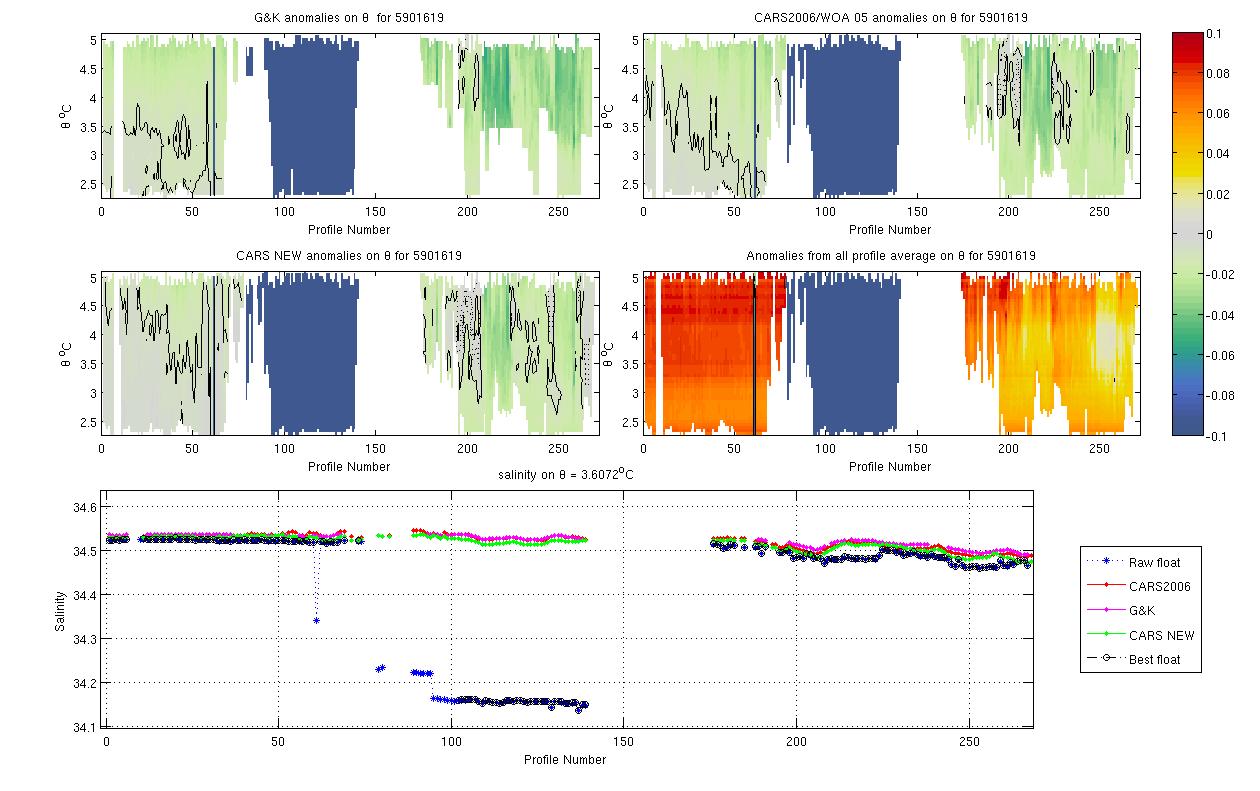
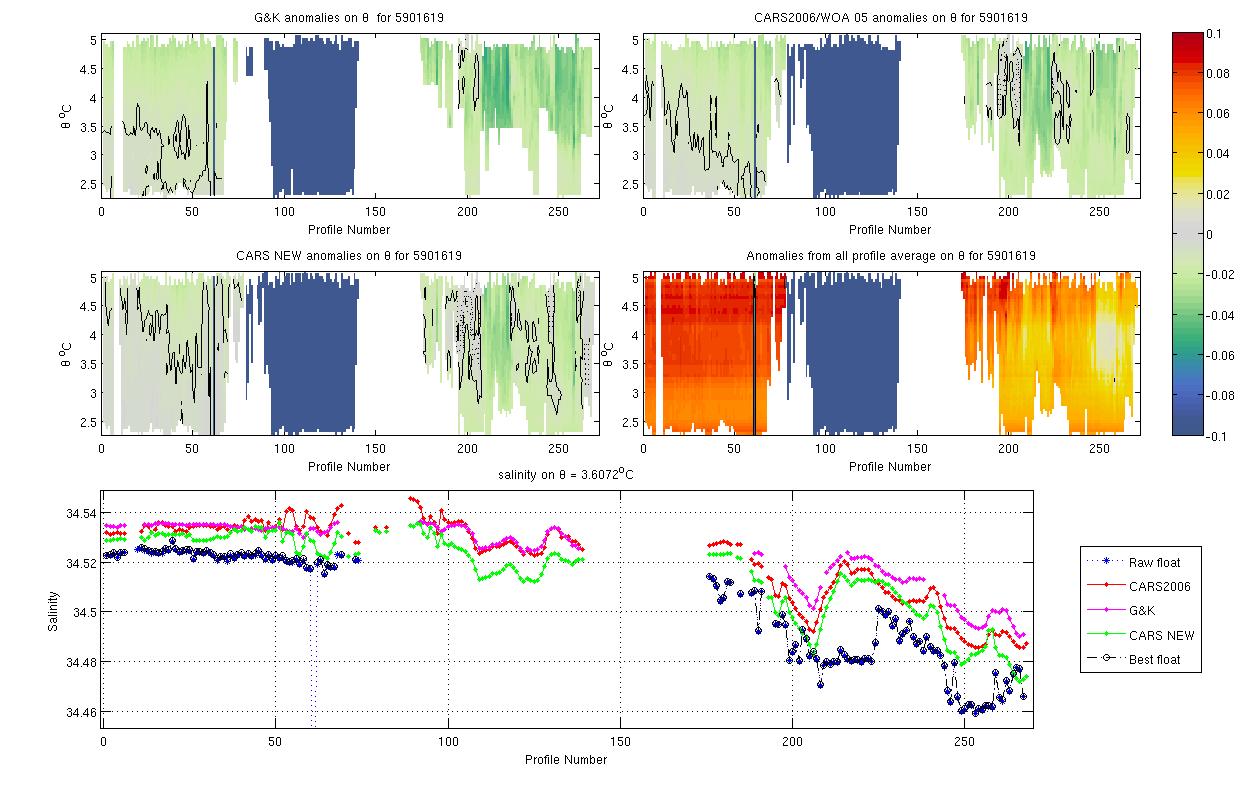
Profile 61 is obviously bad data, there may be gunk trapped in the cell, whole profile QC'd as 4. Float is fine for the first 76 profiles, however from pf 77 (after the float grounded) the salinity sensor has either picked up sediment or been damaged as there is gross salinity drift, salinity data from profile 77 onwards is QC'd as 4.
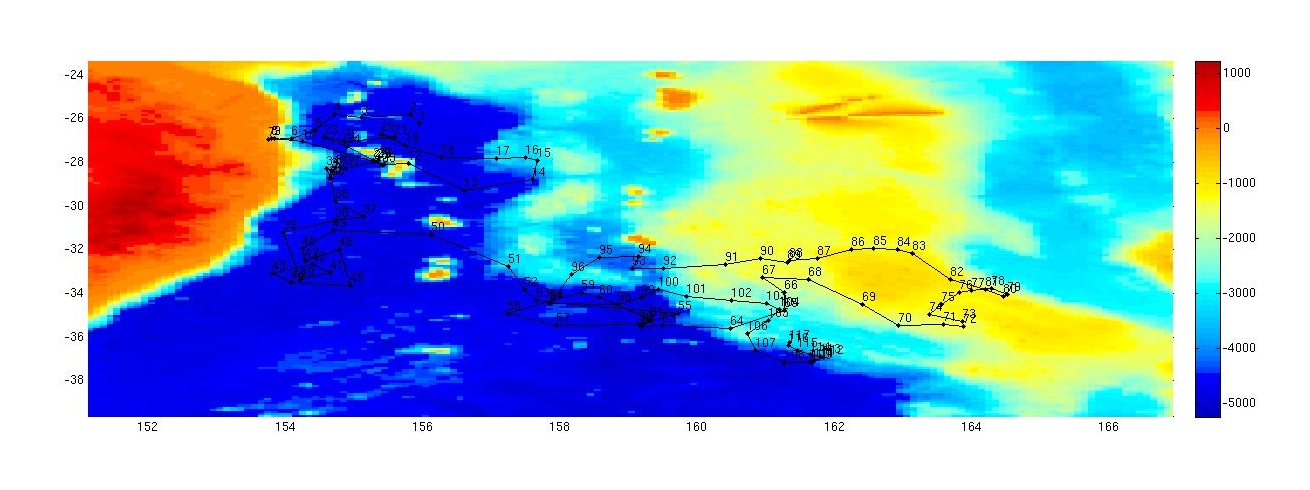
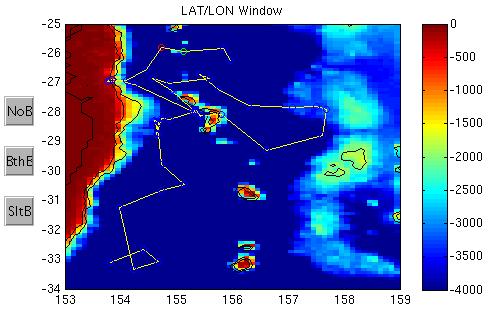
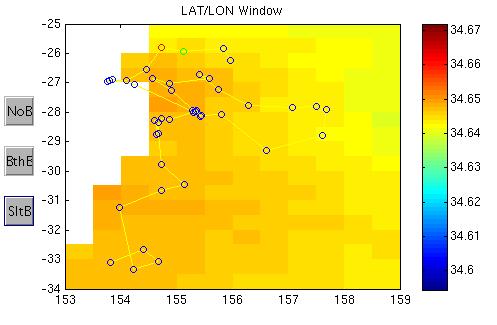
The plots below show the raw float salinity data (solid blue line) compared to neighbouring argo floats (coloured symbols) on a deep potential temperature surface. The locality map shows the location of the profiles for this float and for neighbouring floats.
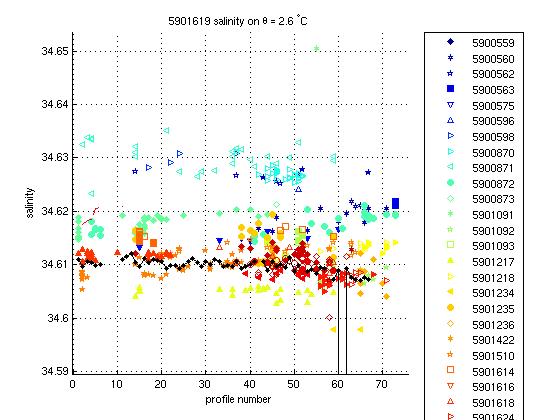
This float is fine compared with nearby argo till pf 77.
This float required no salinity drift correction from pf 1 to 76. From pf 77 onwards salinity data qc'd as 4 due to damage after the float grounded.
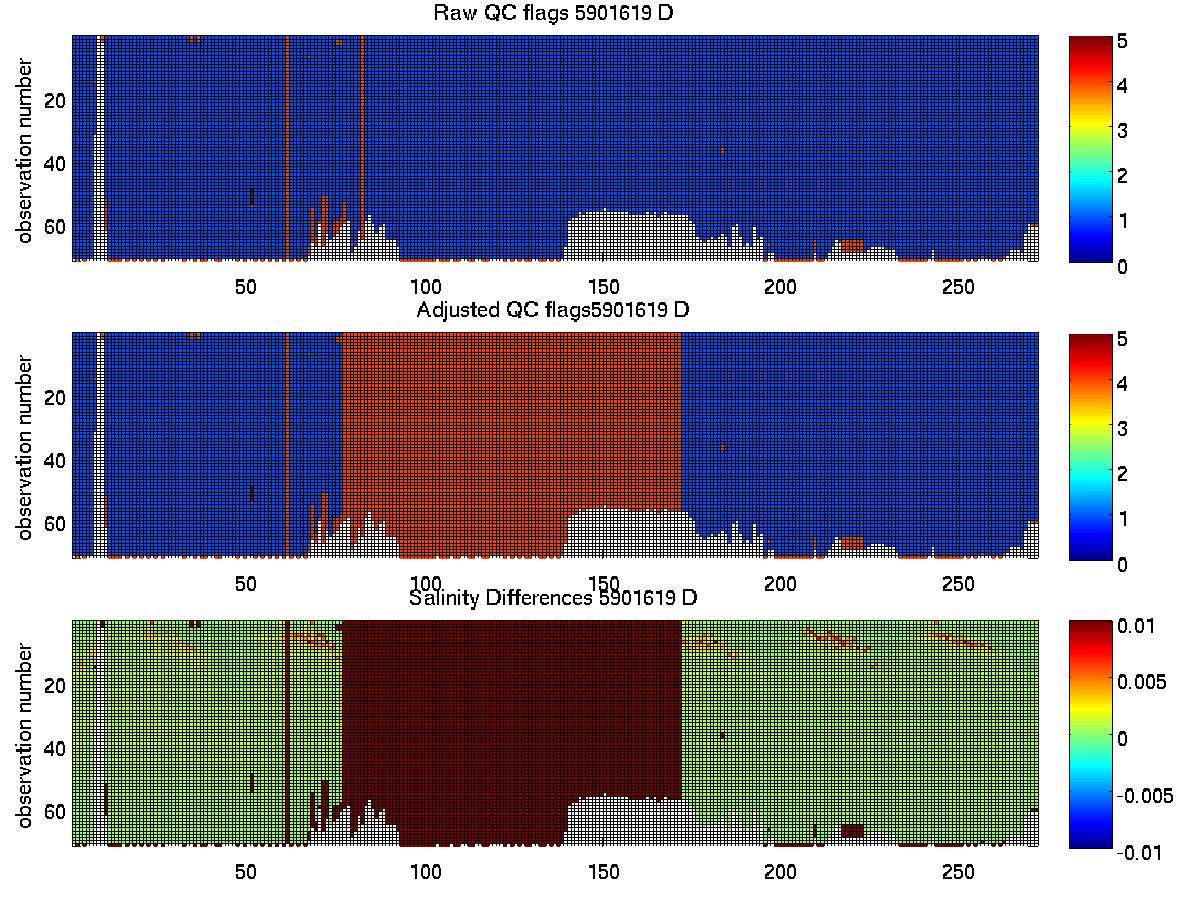
The plot below summarises the QC flags and salinity differences for the raw and adjusted salinity fields in the final delayed mode files submitted to the GDAC.
Created 03-08-2010