The table below provides basic information about the float, including primary sensors, mission parameters and current status of profiles.
| Institute | CSIRO |
| Principal Investigator | Susan Wijffels |
| Pressure Sensor | Druck (serial number=10275) |
| CTD Sensor | APEX-SBE-41 (serial number=2903) |
| CTD Sampling Mode | Burst Sampler |
| Controller Board | APF 8 |
| Additional Sensors/Software | None |
| Park Depth | 1000 m |
| Profile Depth | 2000 m |
| Launch Date | 26-04-2007 |
| Number of D-moded Profiles | 102 |
| Calibration Date | 11-08-2010 |
| Pressure Drift | Surface Pressure Offset corrected |
| Salinity Drift | No salinity drift detected |
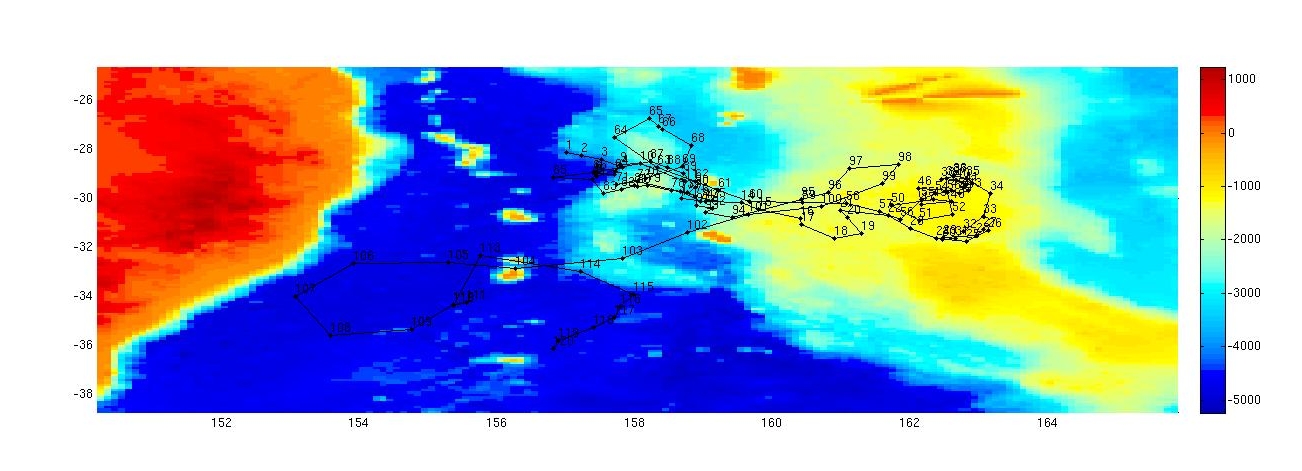
This float was deployed in the Tasman Sea, to the east of Brisbane, in a region bounded by 157 to 164 şE and 28 to 32 şS. The float initially travelled southeast towards the Lord Howe Seamount chain, once there, it eddied around over the shallow bank for just over a year before heading back in almost exactly the same direction from which it came. There are 45 profiles available for DMQC for this float.
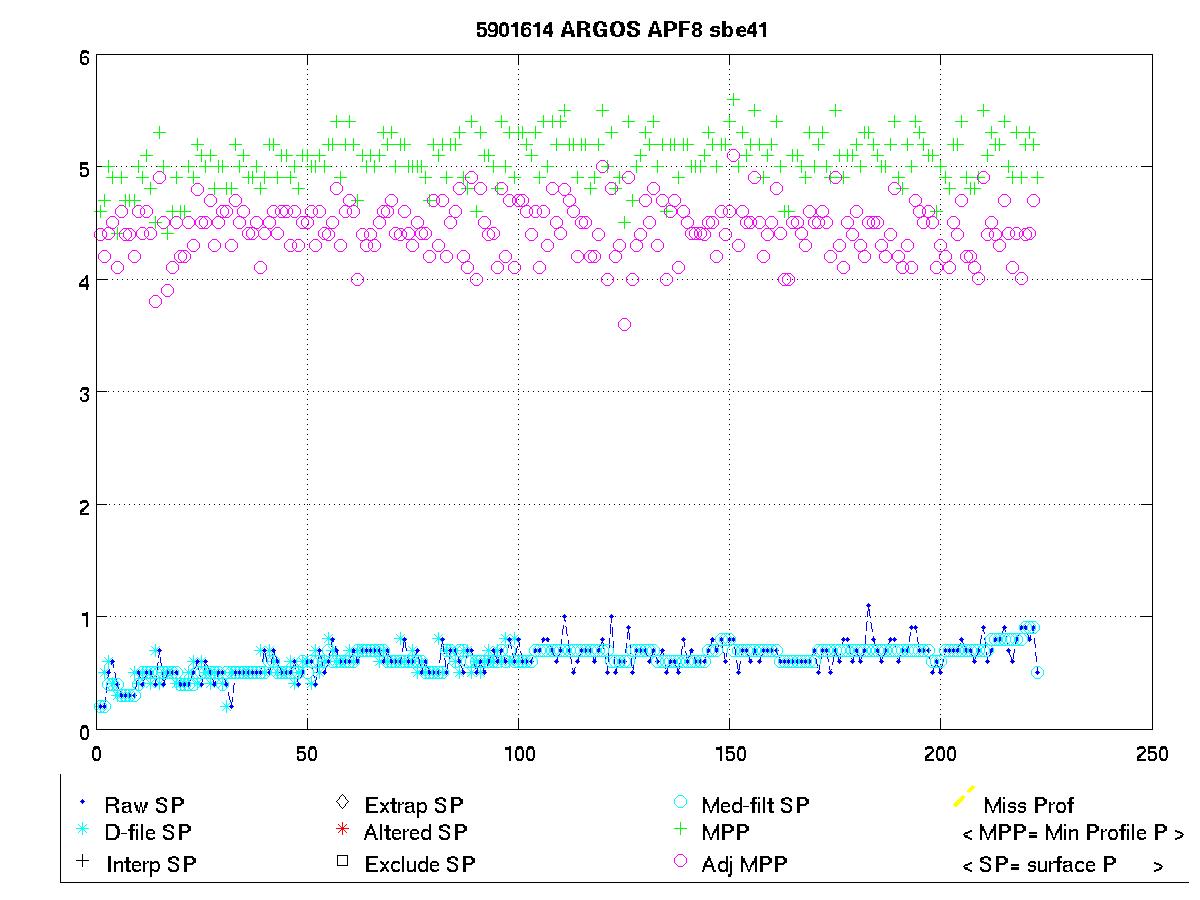
The surface pressure for this float is shown in the plot below.
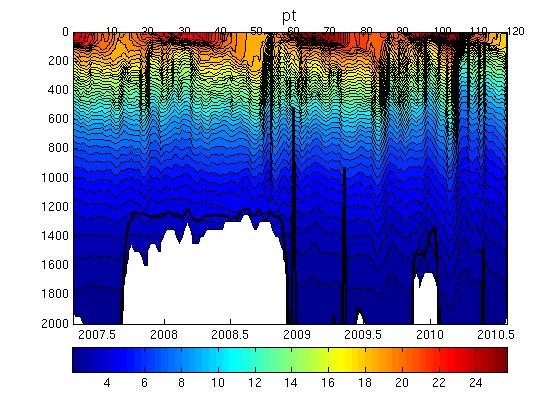
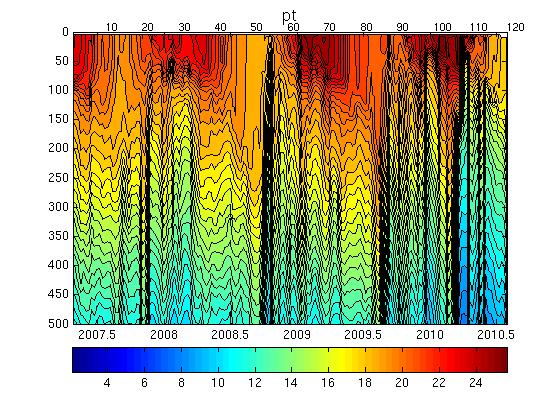
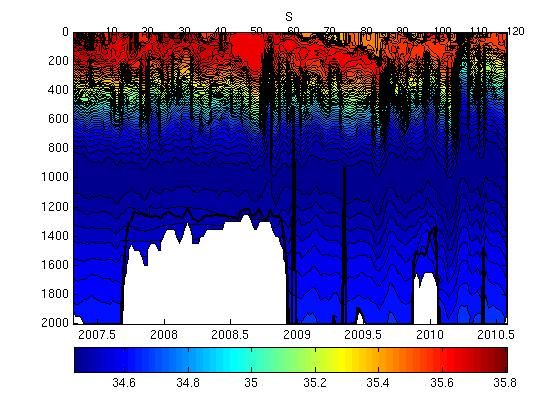
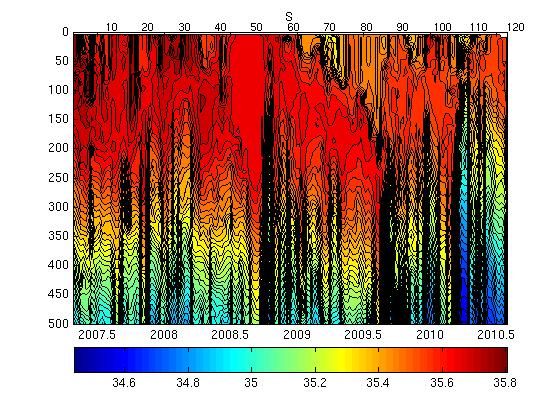
Potential Temperature-Salinity (a), Location (b, Max Temperature (c) and Sea Surface Salinity (d) plots located below.
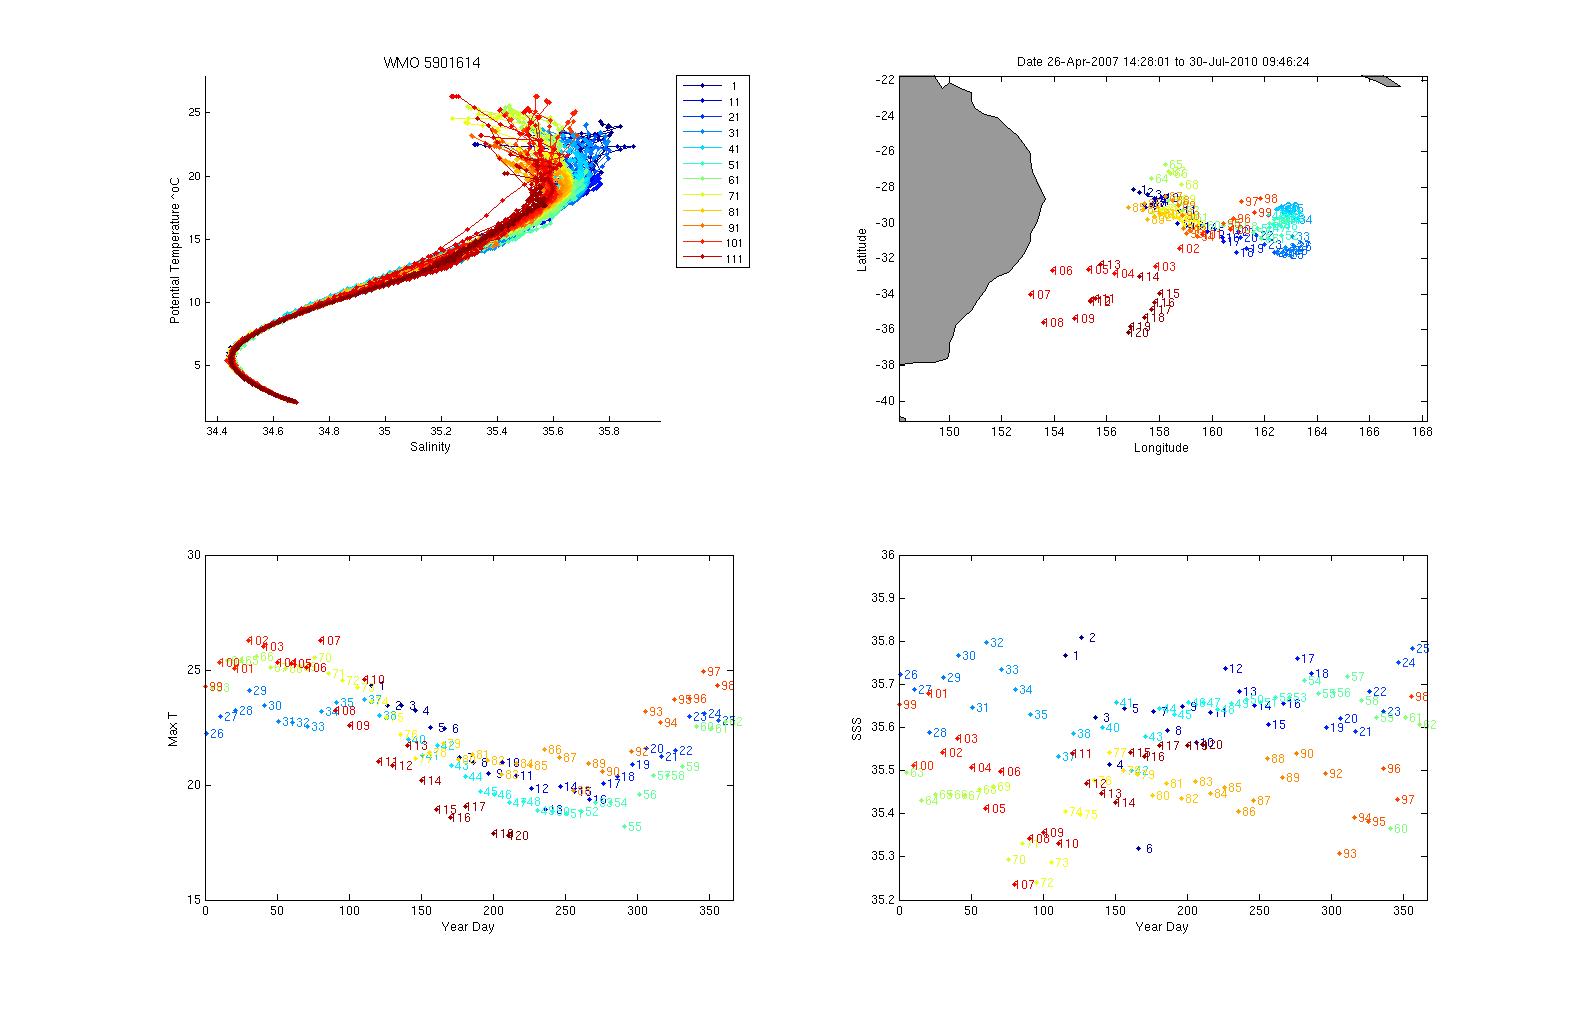
Surface temperatures generally varied between 18 and 25 şC and surface salinities from 35.3 to 35.8.
The plot below shows the potential-temperature/salinity relationship for the deepest theta levels where the relationship between the two parameters should show the least variation.
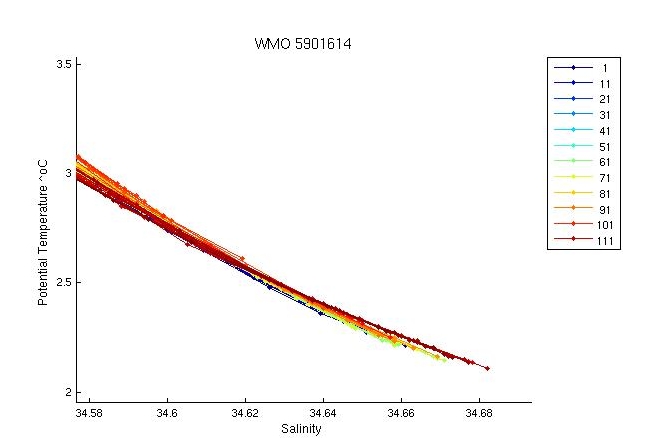
Profiles are very tightly distributed and look fine.
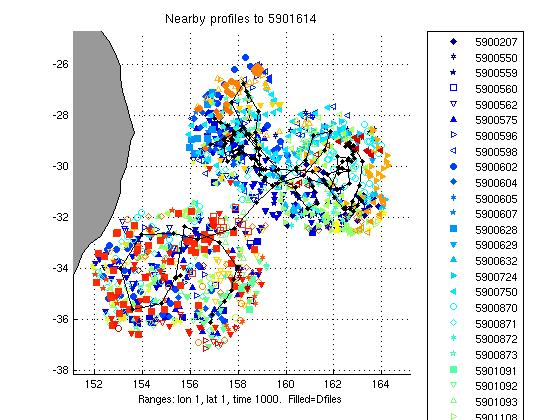
The two plots below show a). the location of this float (black circles) in relation to the position of other nearby argo floats (coloured circles) and b). The potential-temperature/salinity curve for this float (in black) compared to nearby argo floats (coloured).
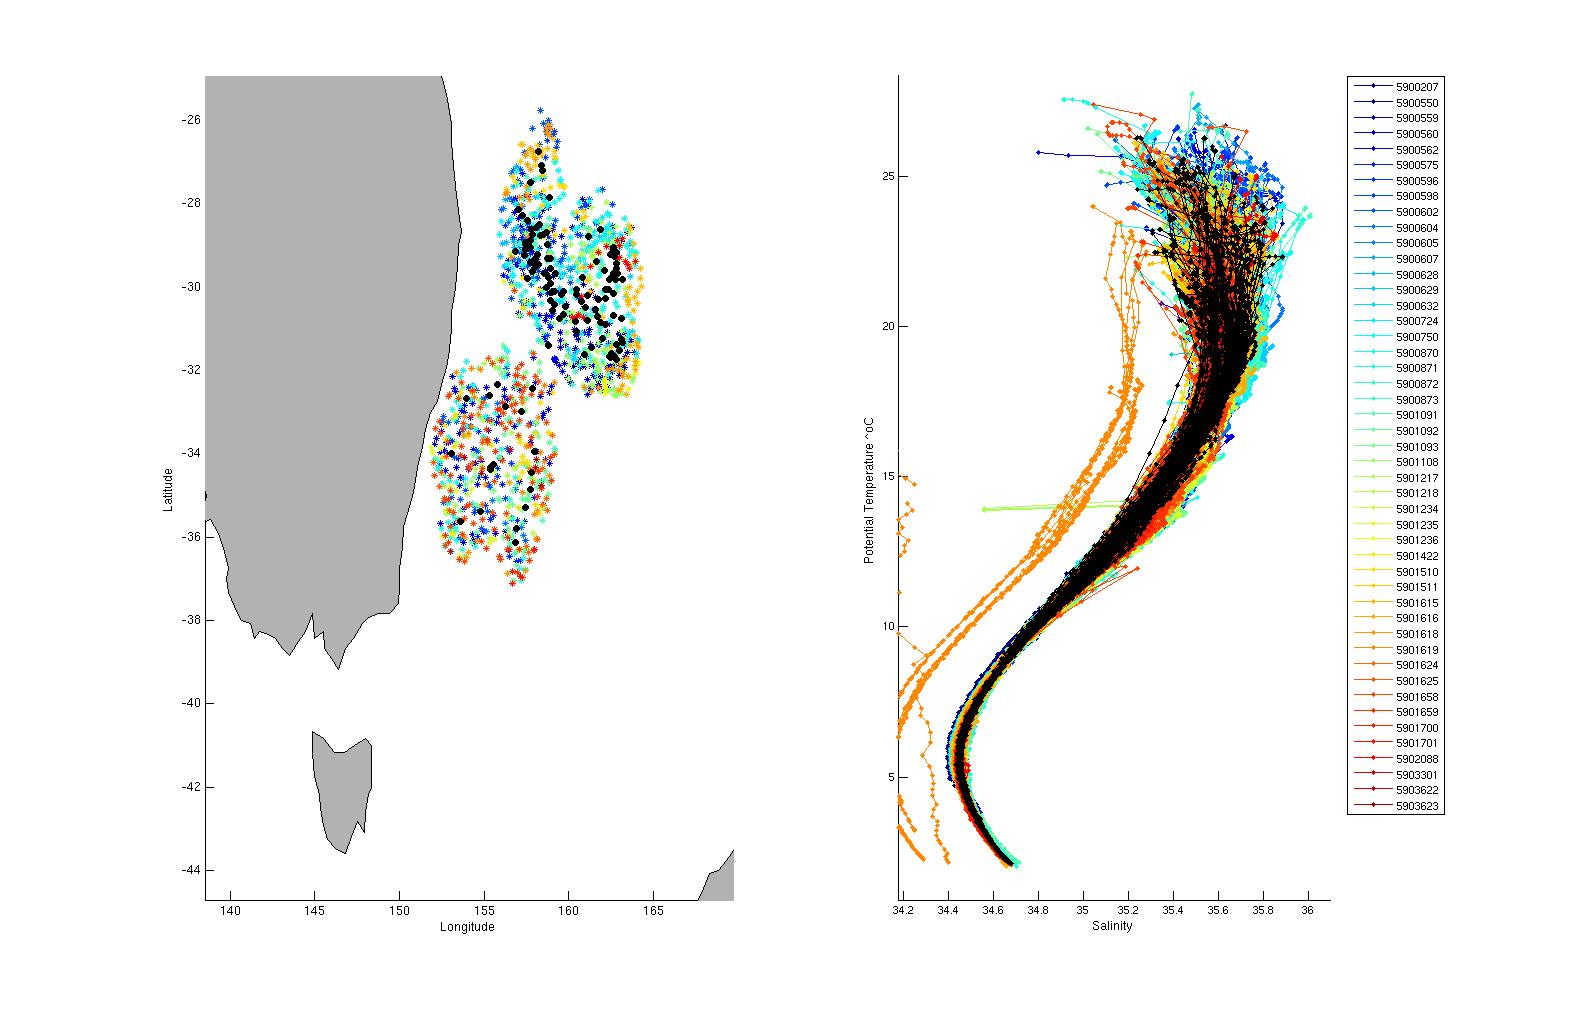
The potential-temperature/salinity relation for the deepest theta levels for this float (in black) and nearby argo floats (coloured) is displayed below.
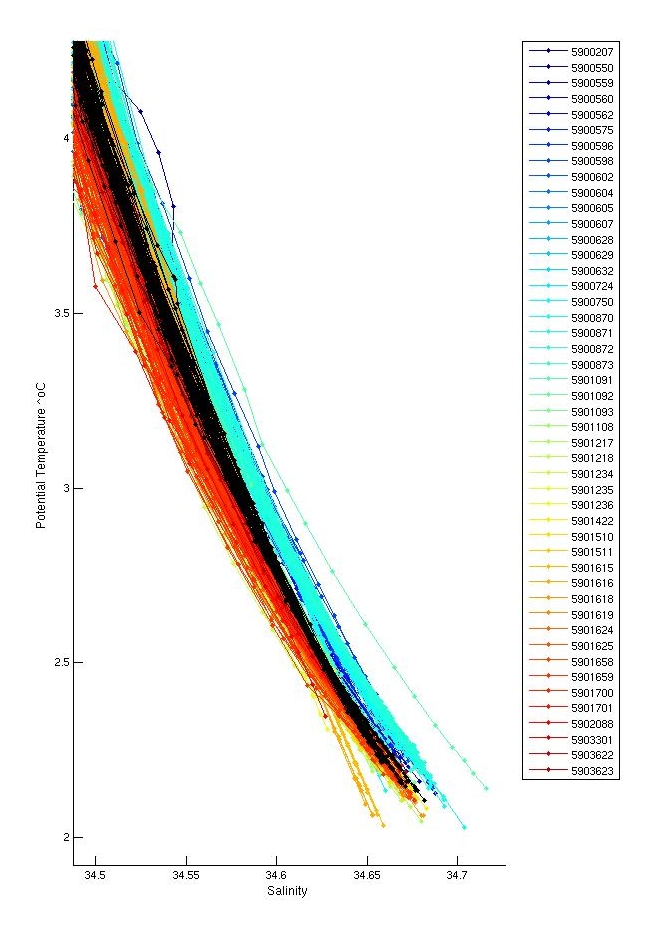
The deep profiles look fine and are in the middle of the envelope.
There was one inversion in profile 32 in the upper water column which was not significant and was therefore not flagged.
Salt hooks were located in profiles; 6,8,10,13,60,61,62,63,64,65,66,67,68,69,70,72,76,82,83,85,87,89,91,93,102. These were flagged as QC 4 for both T & S.
The float grounded on multiple profiles. The bottom sections of most grounded profiles were flagged as QC=4 as the bottom data looked bad. The last value of pf 14 was also flagged as QC=4.
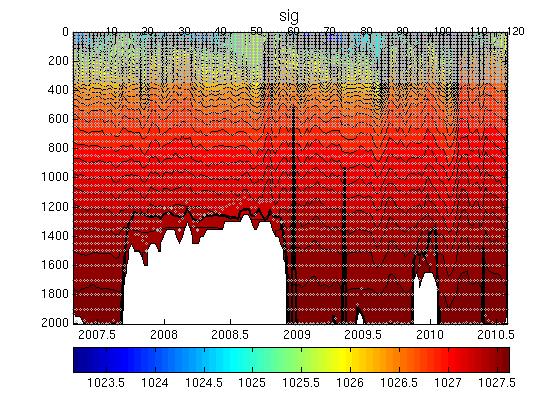
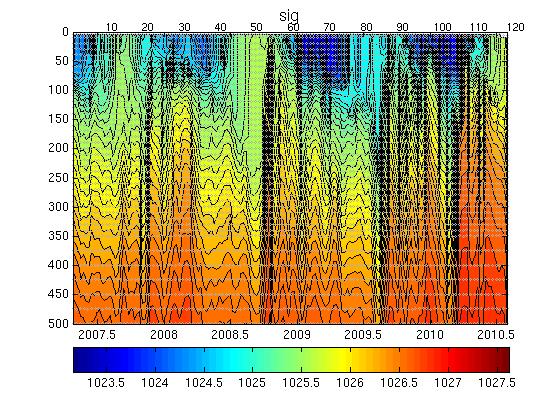
The plot below shows the analysis of salinity drift using the WJO/OW software.

This float requires no correction.
The four plots below show the salinity anomalies on theta surfaces compared to (a) the Gouretski and Kolterman climatology, (b) the CARS (CSIRO Atlas of Regional Seas)/WOA (World Ocean Atlas) climatology, (c) the anomalies within the float series itself, (i.e. the salinity anomaly of each profile from the mean profile average for the float and (d) the raw float salinity compared to the CARS and G&K climatological salinity on a deep theta surface.
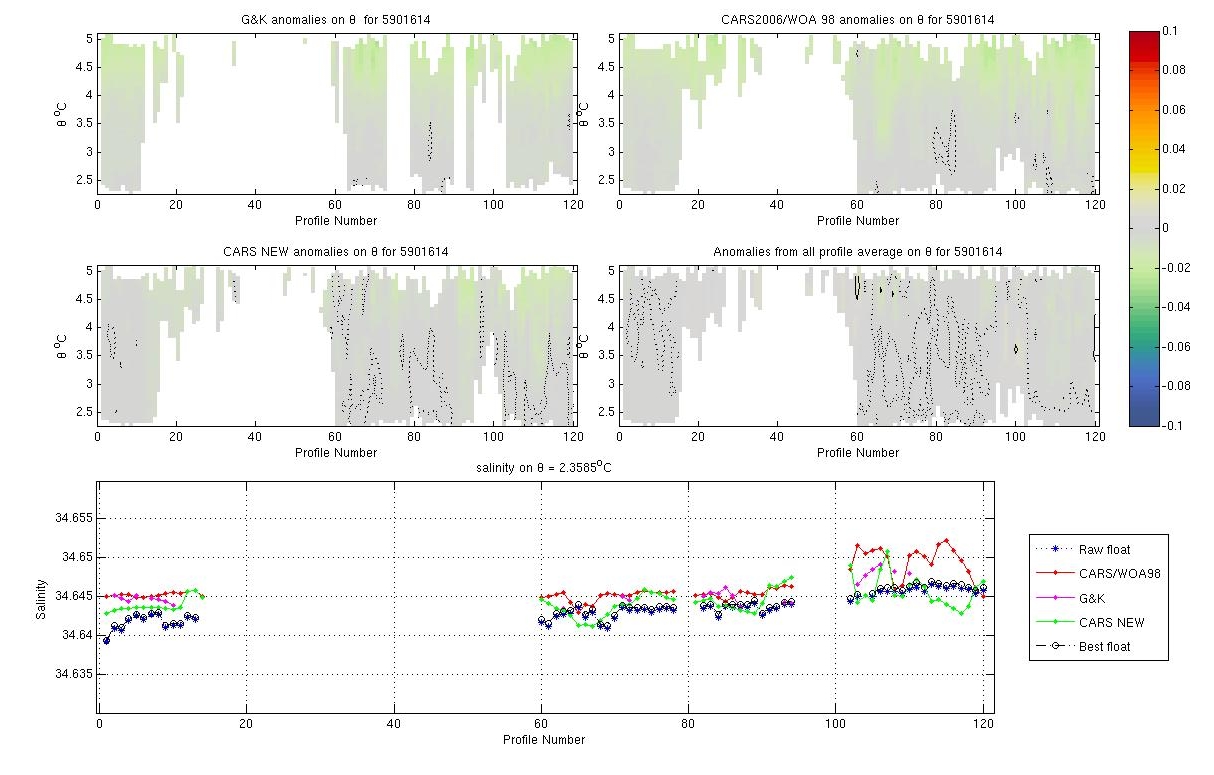
As the float grounded on mutliple profiles there is not consistent data on the very deep theta surfaces, hence a surface of 4.7 C was chosen. The float is fresh offset by 0.01 to 0.015 from both CARS and G & K. However all three datasets follow the same general trend.
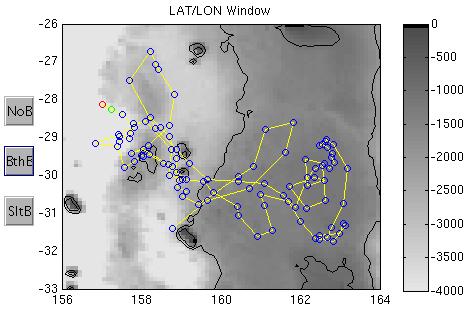
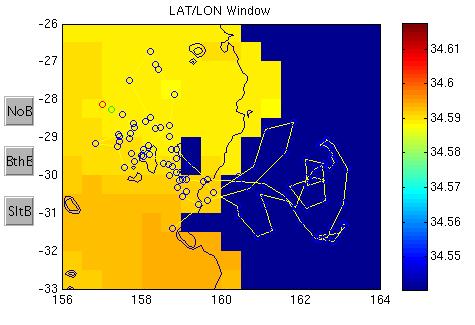
The plots below show the raw float salinity data (solid blue line) compared to neighbouring argo floats (coloured symbols) on a deep potential temperature surface. The locality map shows the location of the profiles for this float and for neighbouring floats.
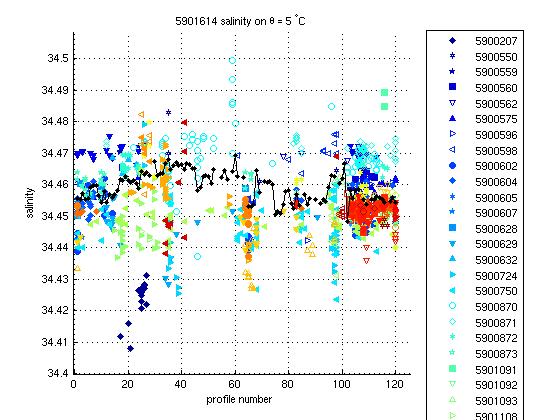
There is a spread of 0.02 in the data at depth.This float however is in the middle of the envelope and looks good.
This float required no salinity drift correction.
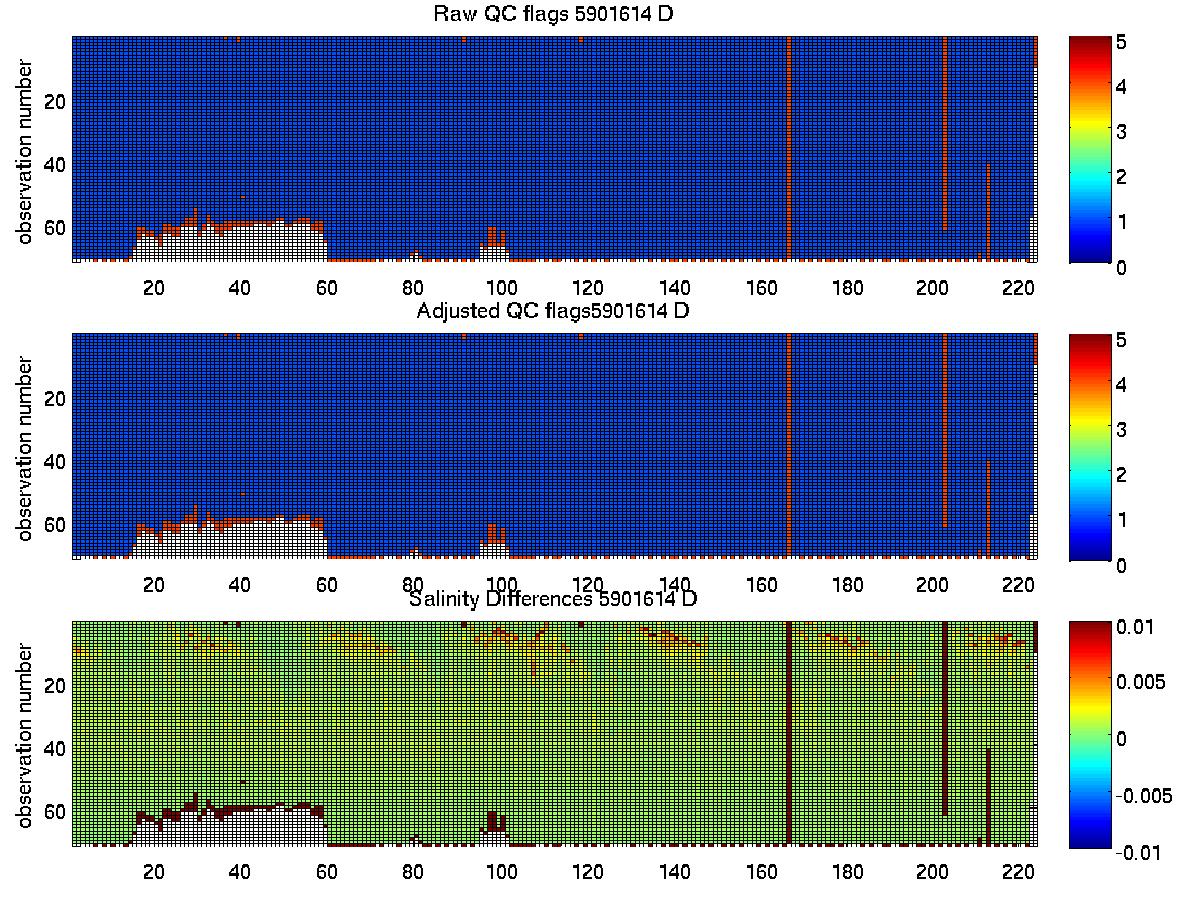
The plot below summarises the QC flags and salinity differences for the raw and adjusted salinity fields in the final delayed mode files submitted to the GDAC.
Created 11-08-2010