The table below provides basic information about the float, including primary sensors, mission parameters and current status of profiles.
| Institute | CSIRO |
| Principal Investigator | Susan Wijffels |
| Pressure Sensor | Druck (serial number=10258) |
| CTD Sensor | APEX-SBE-41 (serial number=2899) |
| CTD Sampling Mode | Burst Sampler |
| Controller Board | APF 8 |
| Additional Sensors/Software | None |
| Park Depth | 1000 m |
| Profile Depth | 2000 m |
| Launch Date | 14-04-2007 |
| Number of D-moded Profiles | 104 |
| Calibration Date | 12-08-2010 |
| Pressure Drift | Surface Pressure Offset corrected |
| Salinity Drift | No salinity drift detected |
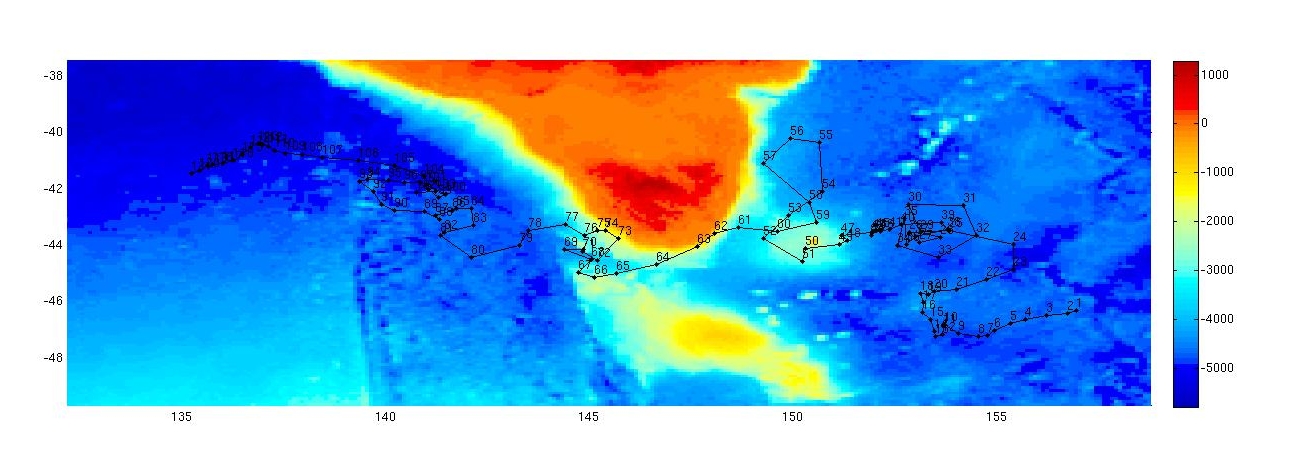
This float was deployed in the Tasman Sea, to the east of Tasmania, in a region bounded by 146 to 157 şE and 40 to 48 şS. The float has meandered in an overall northwesterly direction and is about to pass to the south of Tasmania. There are 46 profiles available for DMQC for this float.
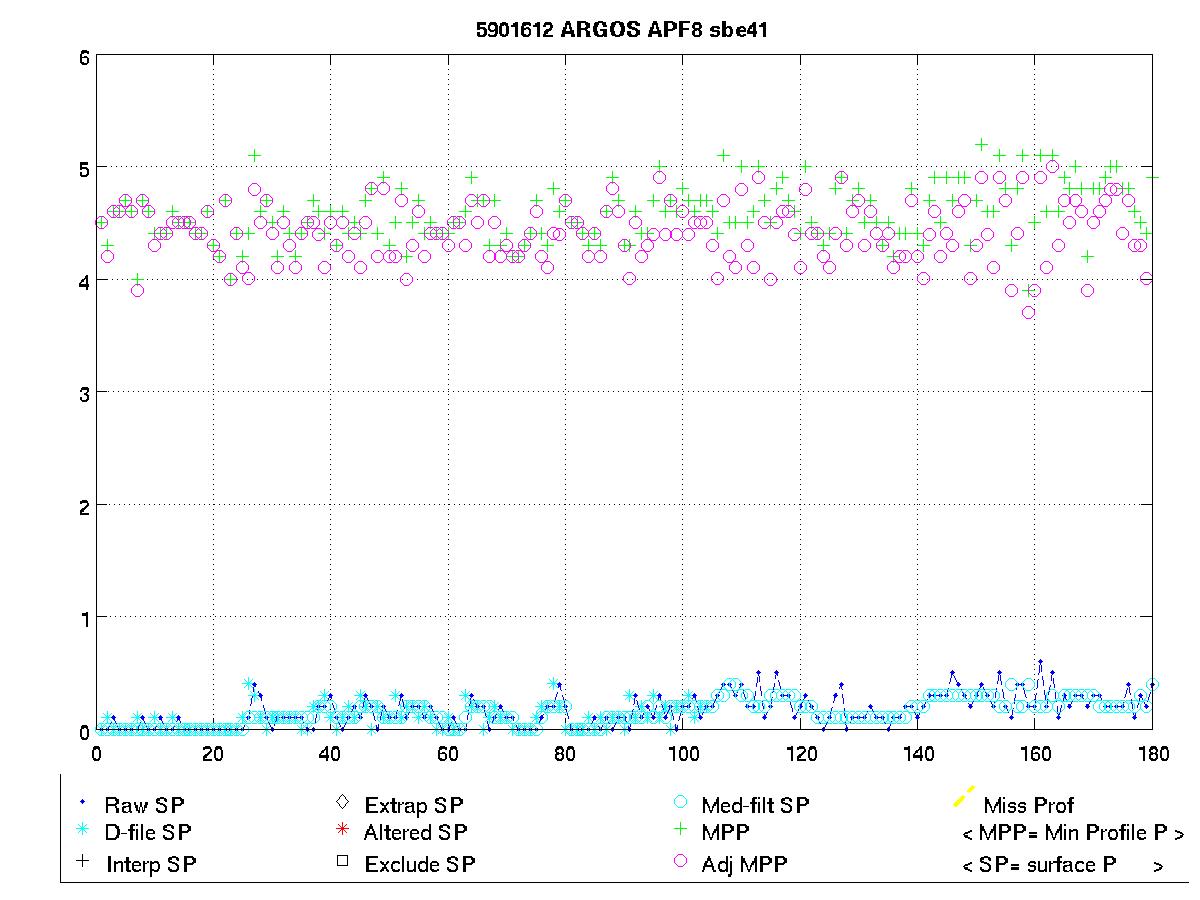
The surface pressure for this float is shown in the plot below.
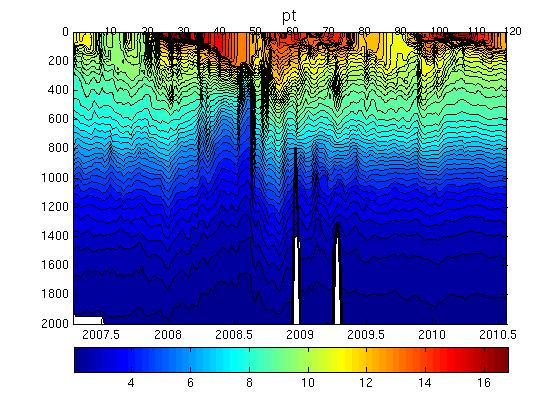
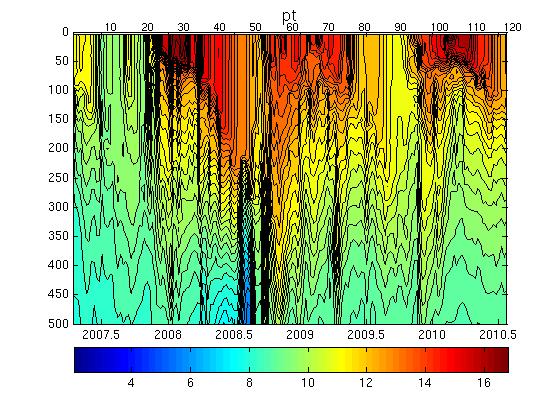
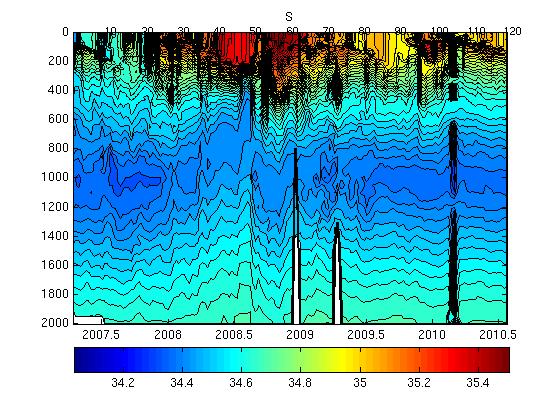
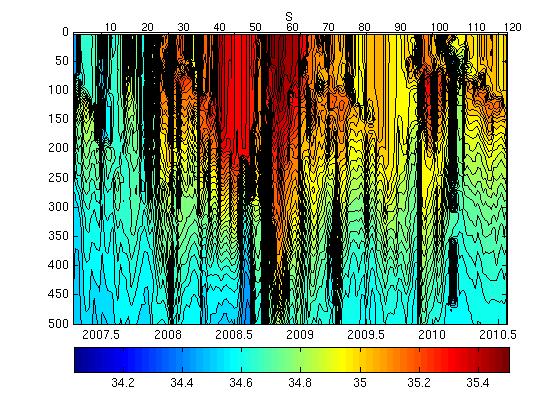
Potential Temperature-Salinity (a), Location (b, Max Temperature (c) and Sea Surface Salinity (d) plots located below.
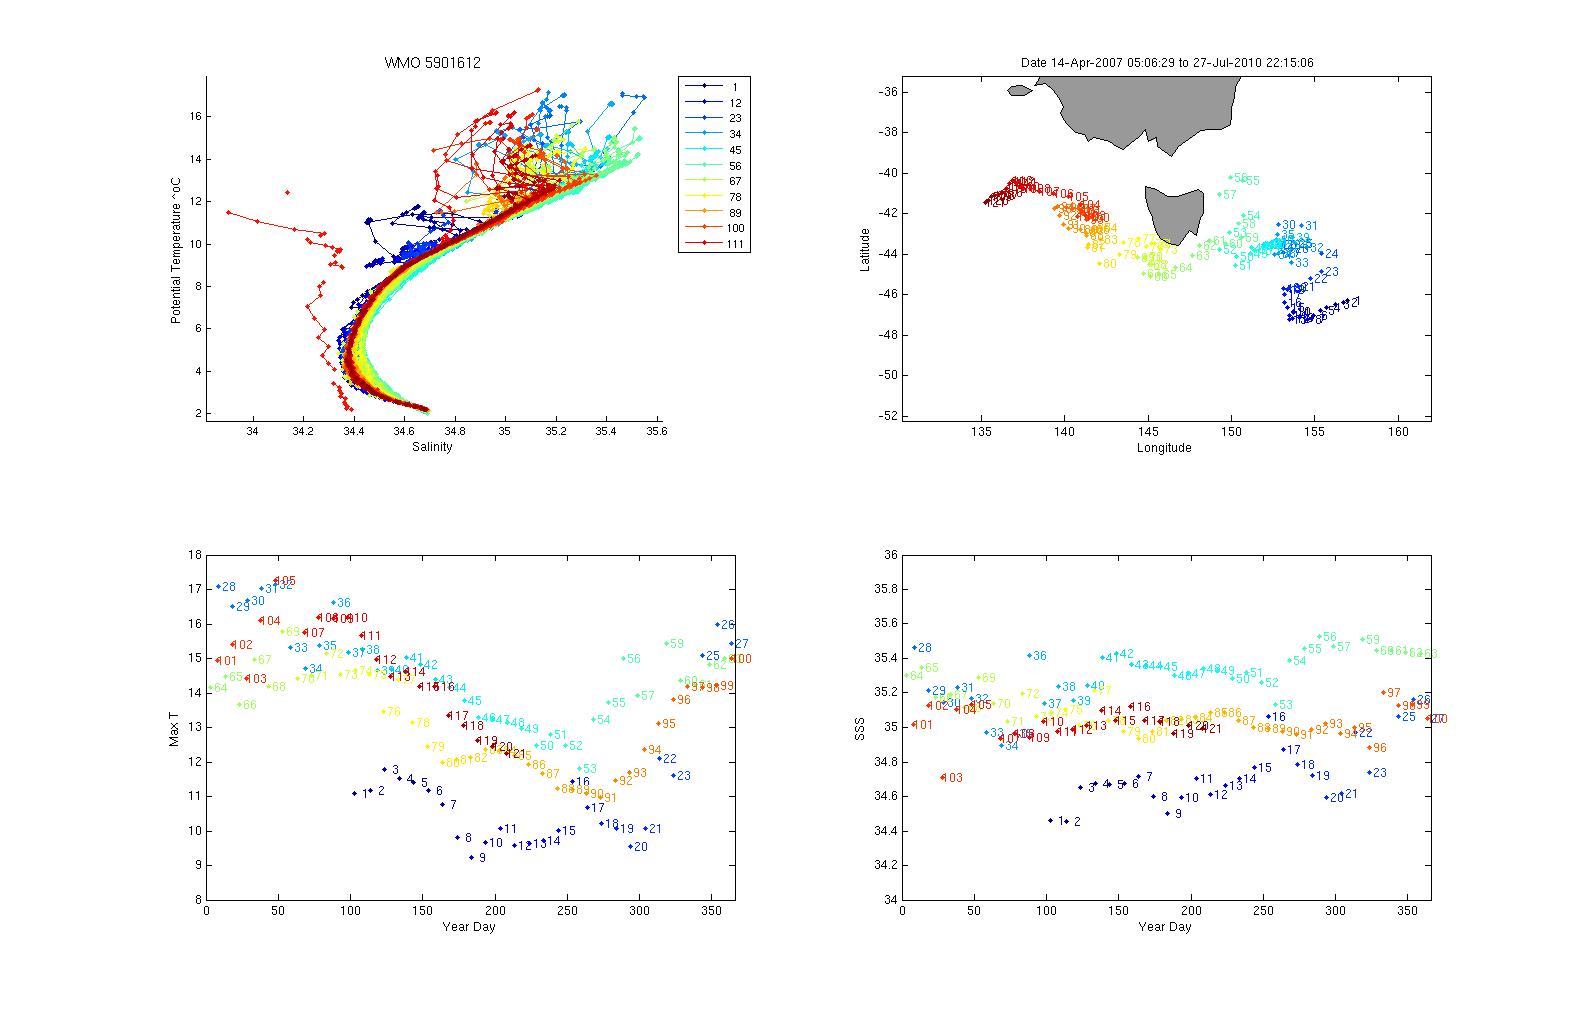
Surface temperatures generally varied between 9 and 17 şC and surface salinities from 34.4 to 35.6.
The plot below shows the potential-temperature/salinity relationship for the deepest theta levels where the relationship between the two parameters should show the least variation.
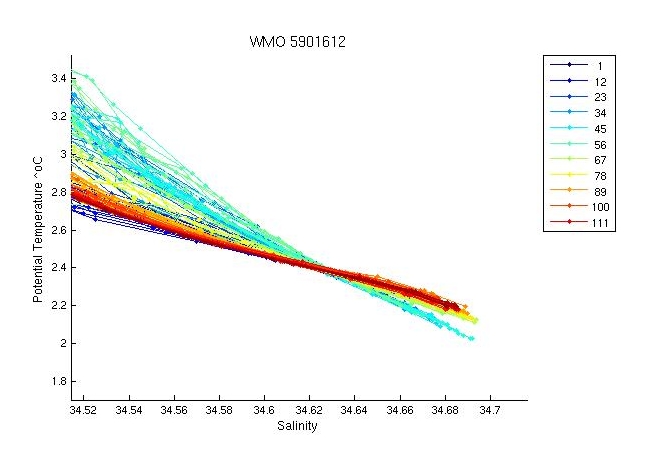
The deep profiles look fine with the exception of the bottom values of one profile, 24. Check this in Gilson 1.
The two plots below show a). the location of this float (black circles) in relation to the position of other nearby argo floats (coloured circles) and b). The potential-temperature/salinity curve for this float (in black) compared to nearby argo floats (coloured).
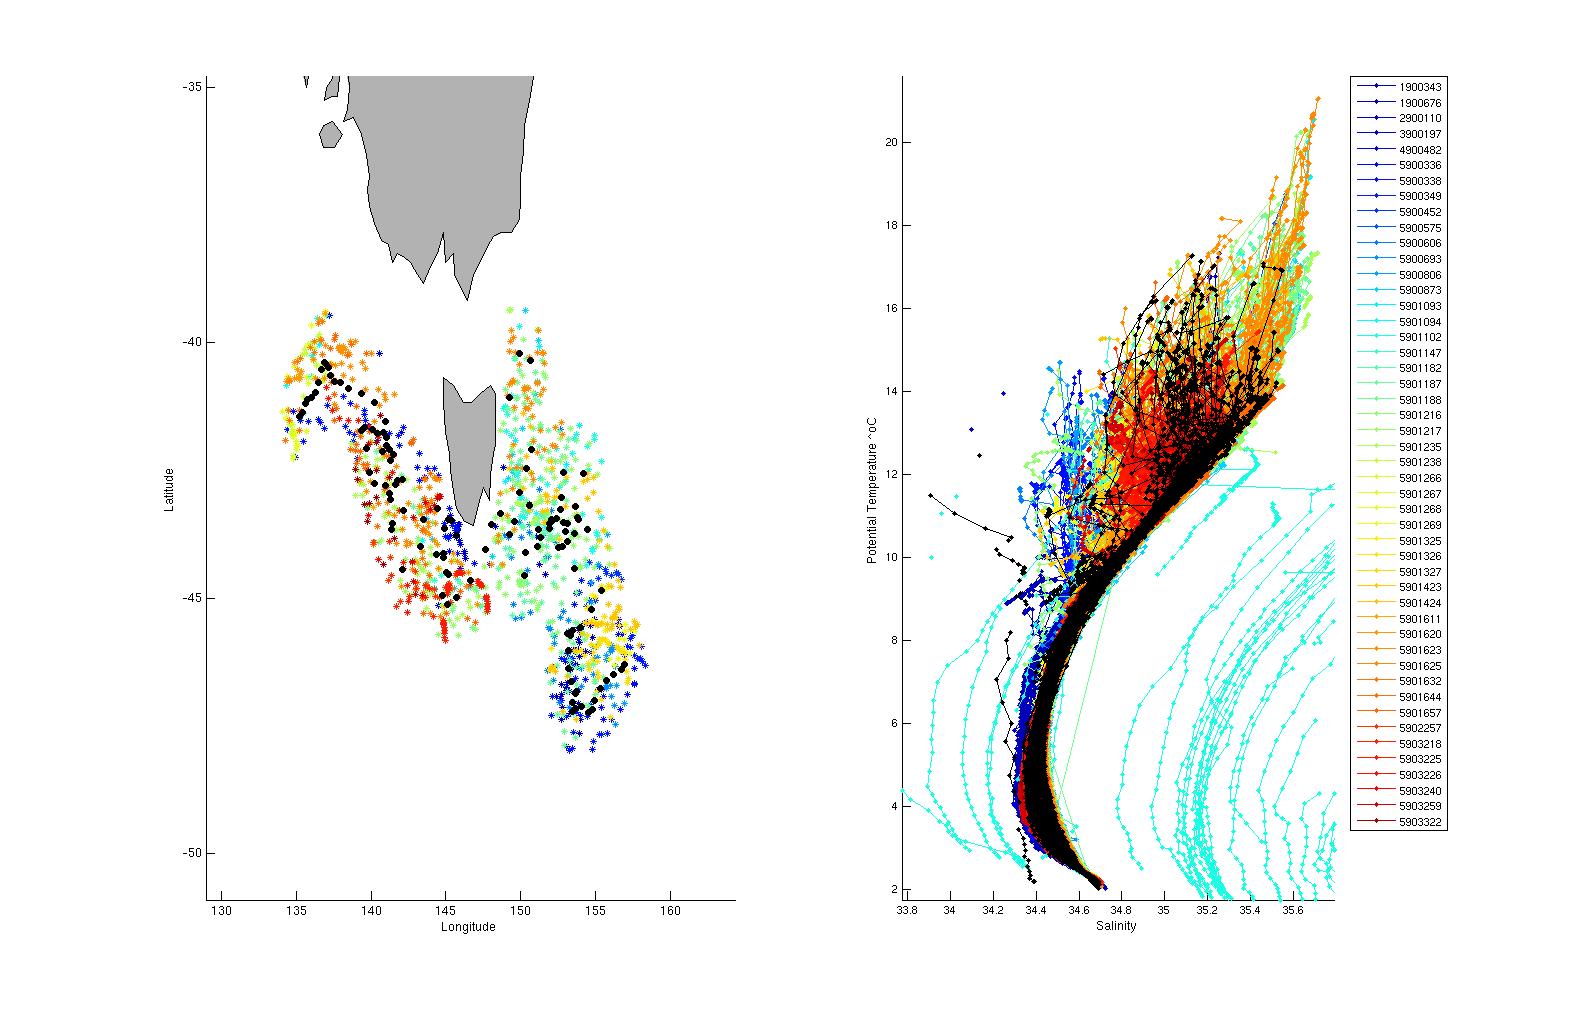
The potential-temperature/salinity relation for the deepest theta levels for this float (in black) and nearby argo floats (coloured) is displayed below.
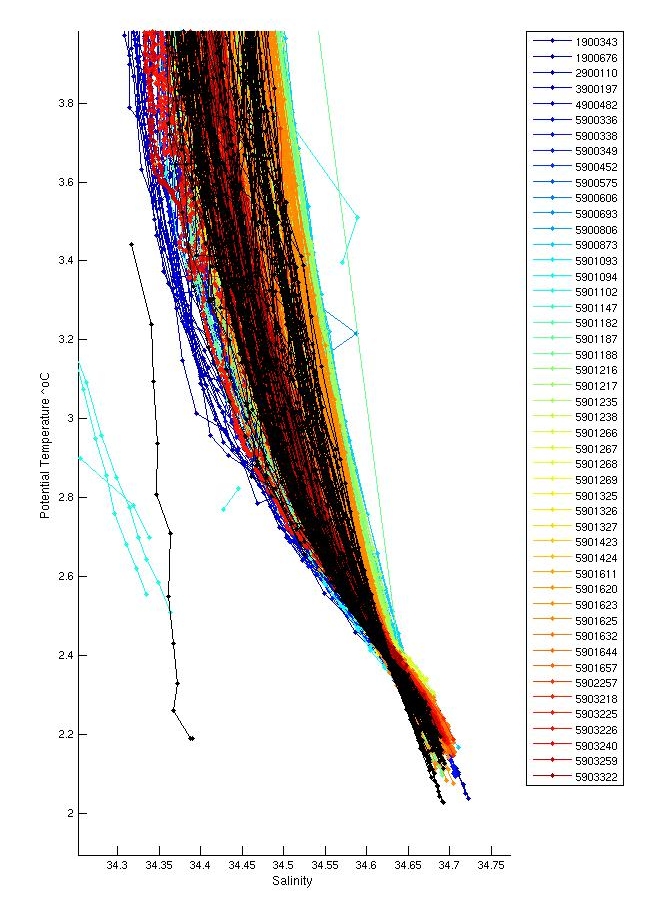
The deep profiles for this float look fine.
There were inversions in profiles; 9,29,37,41,46,65. None of these were significant and were not flagged.
Salt hooks were located in profiles; 3,5,6,8,10,12,15,16,18,20,22,23,26,27,29,32,37,39,42,44,46,49,51,54,55,57,61,64,65,67,70,77,79,82,83,84,85,87,88. These were flagged as QC 4 for both T & S.
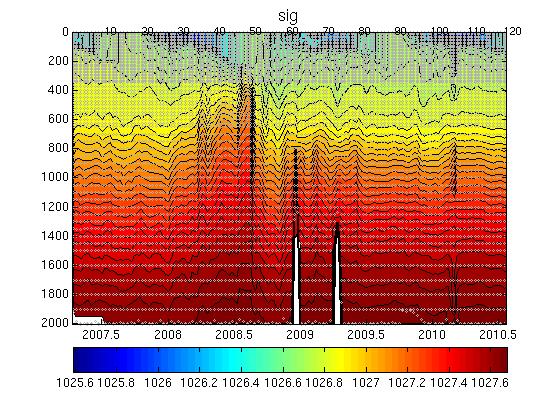
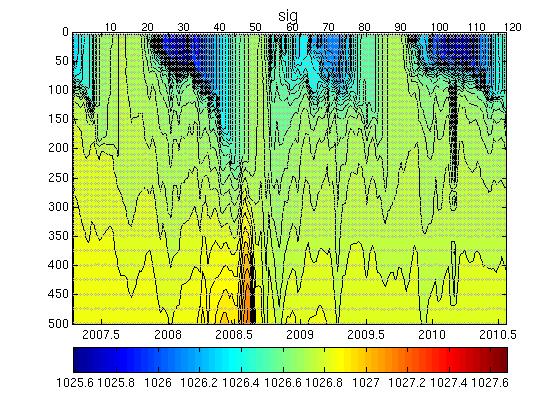
There were no missing profiles. The float looks like it grounded on profiles 62 and 63. Profile 24 looks odd particularly at depth but the whole profile hangs out of the envelope (see sigma section plot). QC this as bad and revisit when more profiles are available.
The plot below shows the analysis of salinity drift using the WJO/OW software.

The four plots below show the salinity anomalies on theta surfaces compared to (a) the Gouretski and Kolterman climatology, (b) the CARS (CSIRO Atlas of Regional Seas)/WOA (World Ocean Atlas) climatology, (c) the anomalies within the float series itself, (i.e. the salinity anomaly of each profile from the mean profile average for the float and (d) the raw float salinity compared to the CARS and G&K climatological salinity on a deep theta surface.
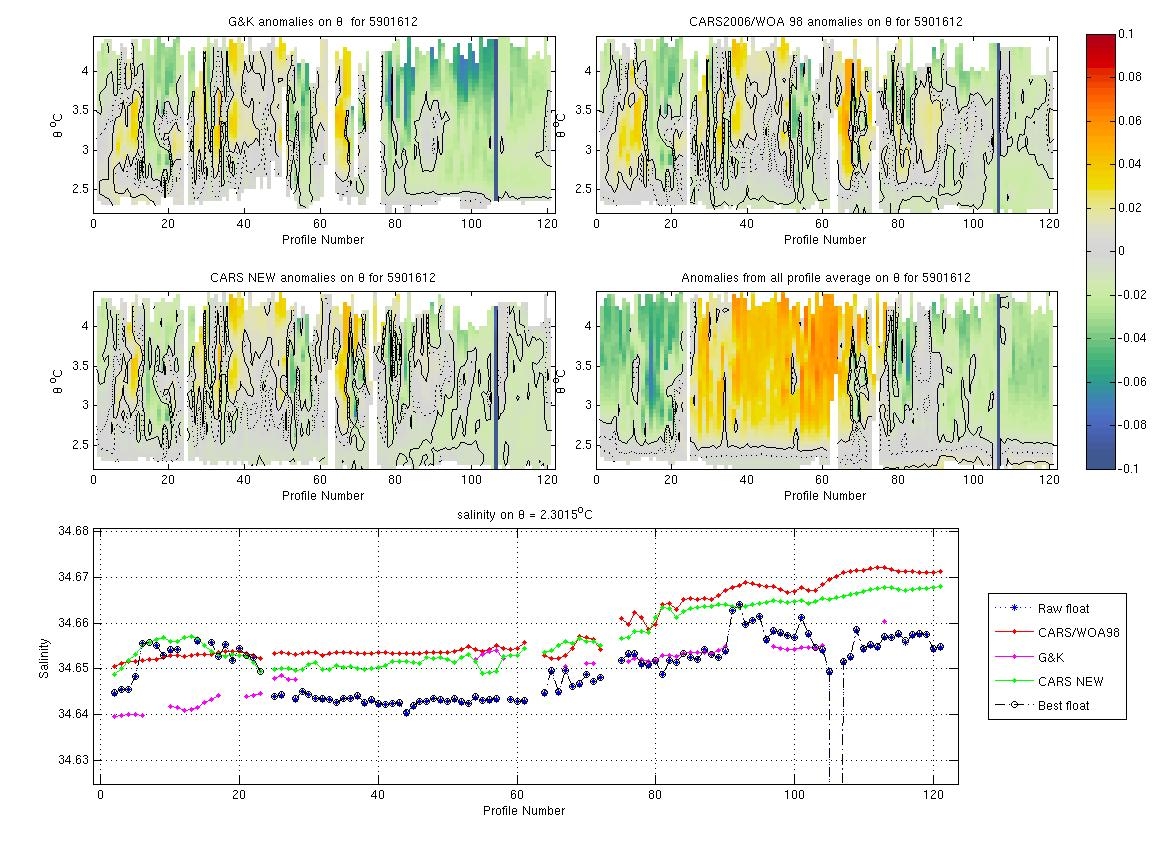
This float is close to Gouretski and Kolterman climatology for most of the series and at times is close to new CARS. This region is highly variable and it is likely that the float has crossed a front multiple times. Profle 106 is affected by fresh fouling - with some biological material being sucked into the cell. QC this whole profile as 4 for sal.
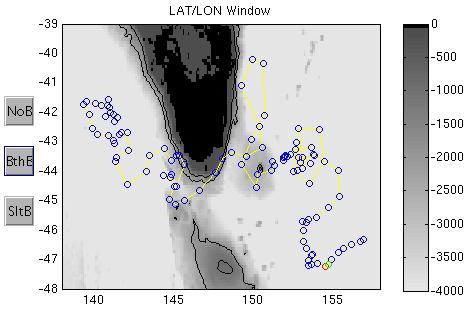
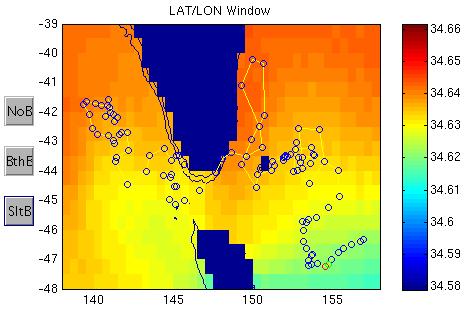
The plots below show the raw float salinity data (solid blue line) compared to neighbouring argo floats (coloured symbols) on a deep potential temperature surface. The locality map shows the location of the profiles for this float and for neighbouring floats.
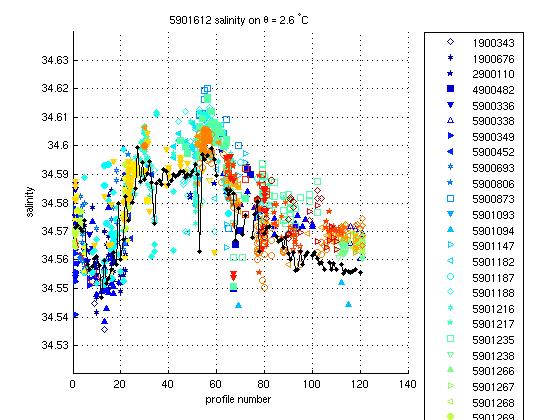
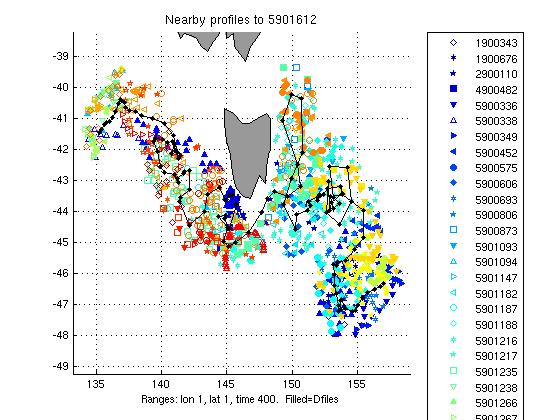
This float is at the fresher end of the data envelope but is fine.
This float required no salinity drift correction.
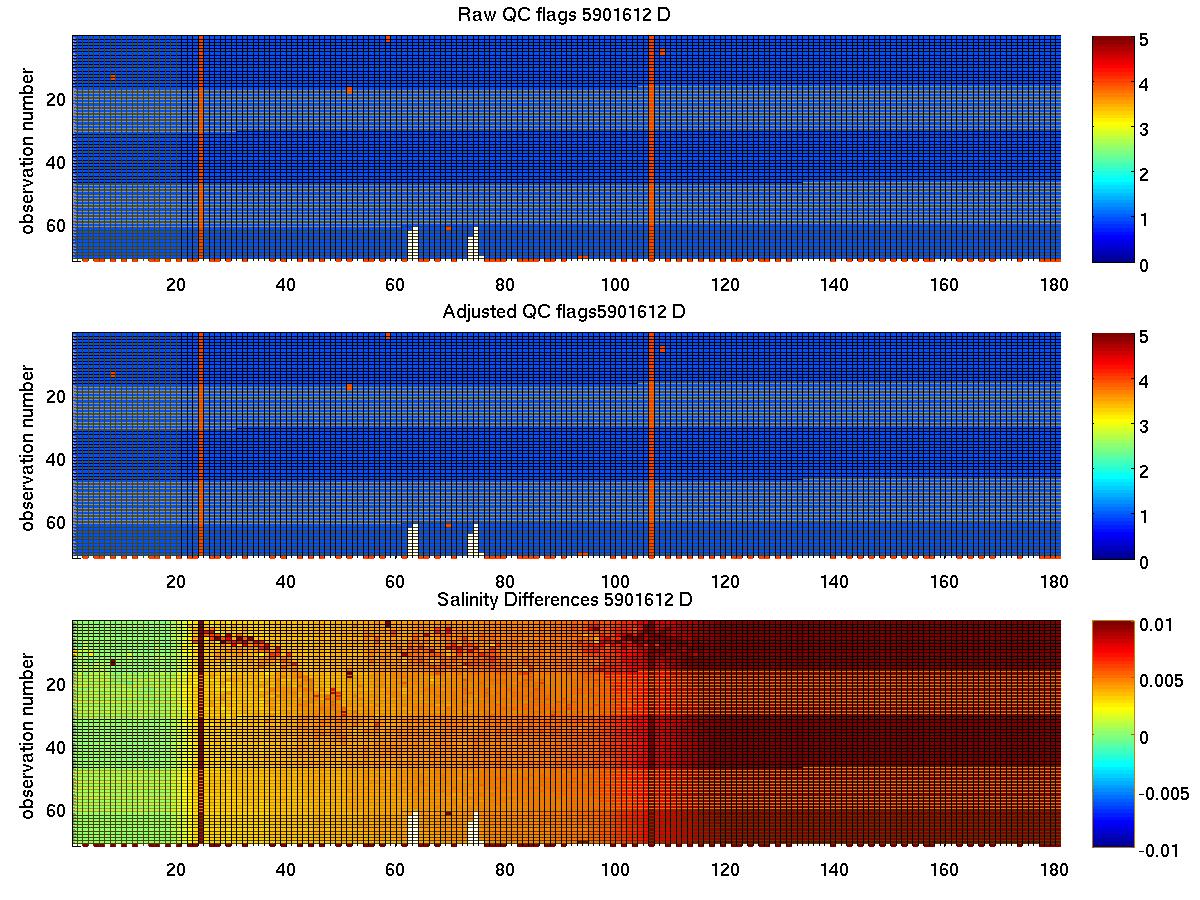
The plot below summarises the QC flags and salinity differences for the raw and adjusted salinity fields in the final delayed mode files submitted to the GDAC.
Created 12-08-2010