The table below provides basic information about the float, including primary sensors, mission parameters and current status of profiles.
| Institute | CSIRO |
| Principal Investigator | Susan Wijffels |
| Pressure Sensor | Druck (serial number=10432) |
| CTD Sensor | APEX-SBE-41 (serial number=2964) |
| CTD Sampling Mode | Burst Sampler |
| Controller Board | APF 8 |
| Additional Sensors/Software | None |
| Park Depth | 1000 m |
| Profile Depth | 2000 m |
| Launch Date | 12-03-2007 |
| Number of D-moded Profiles | 107 |
| Calibration Date | 12-08-2010 |
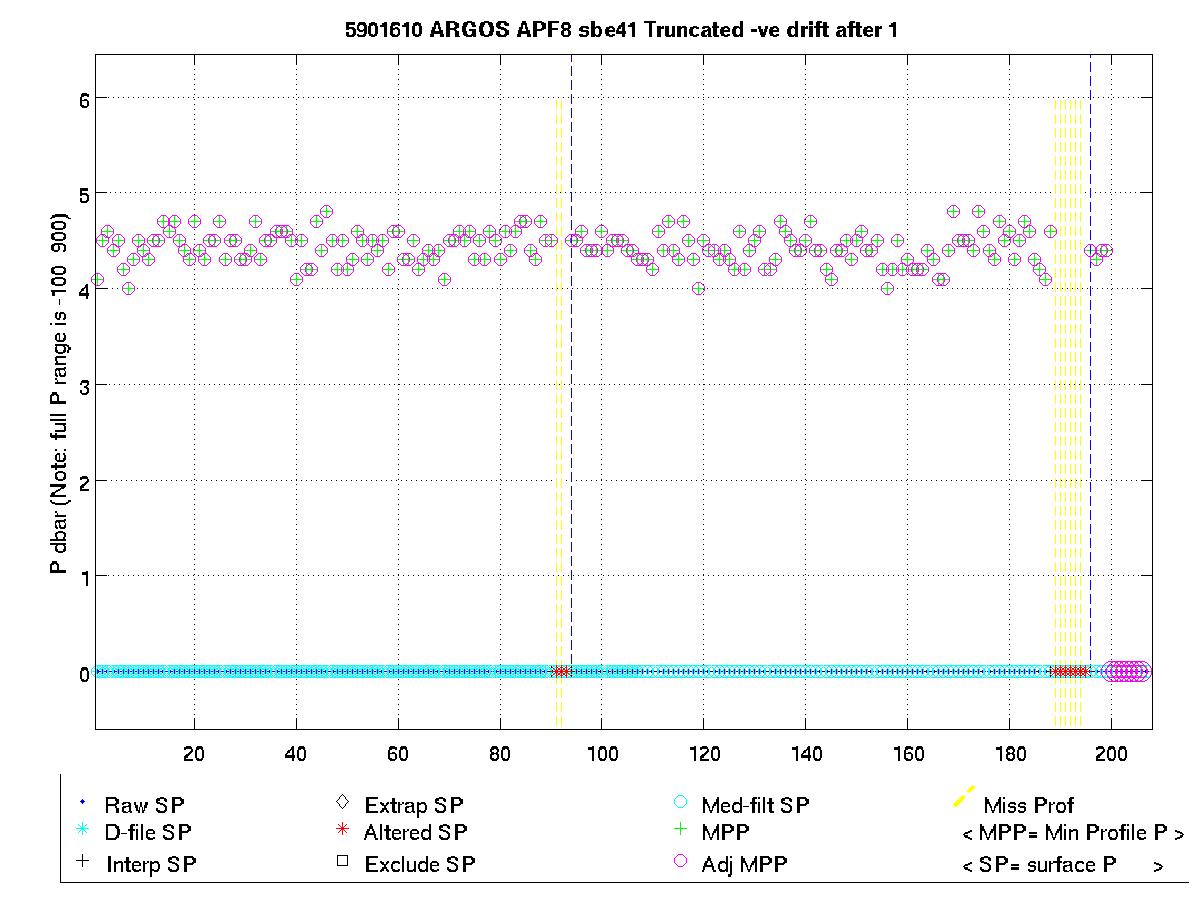
| Pressure Drift | Surface Pressure Offset unknown and uncorrectable from profile 1 onwards, TNDP float, QC=2, serial number < 2324175 |
| Salinity Drift | No salinity drift detected |
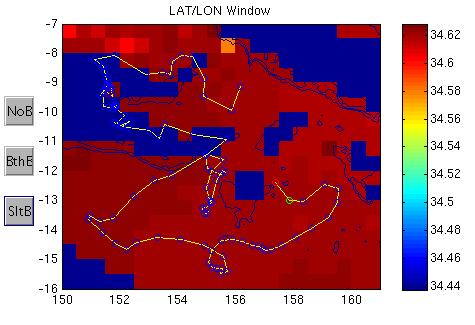
This float was deployed in the Coral Sea, in a region bounded by 151 to 160 şE and 10 to 16 şS.
The surface pressure for this float is shown in the plot below.
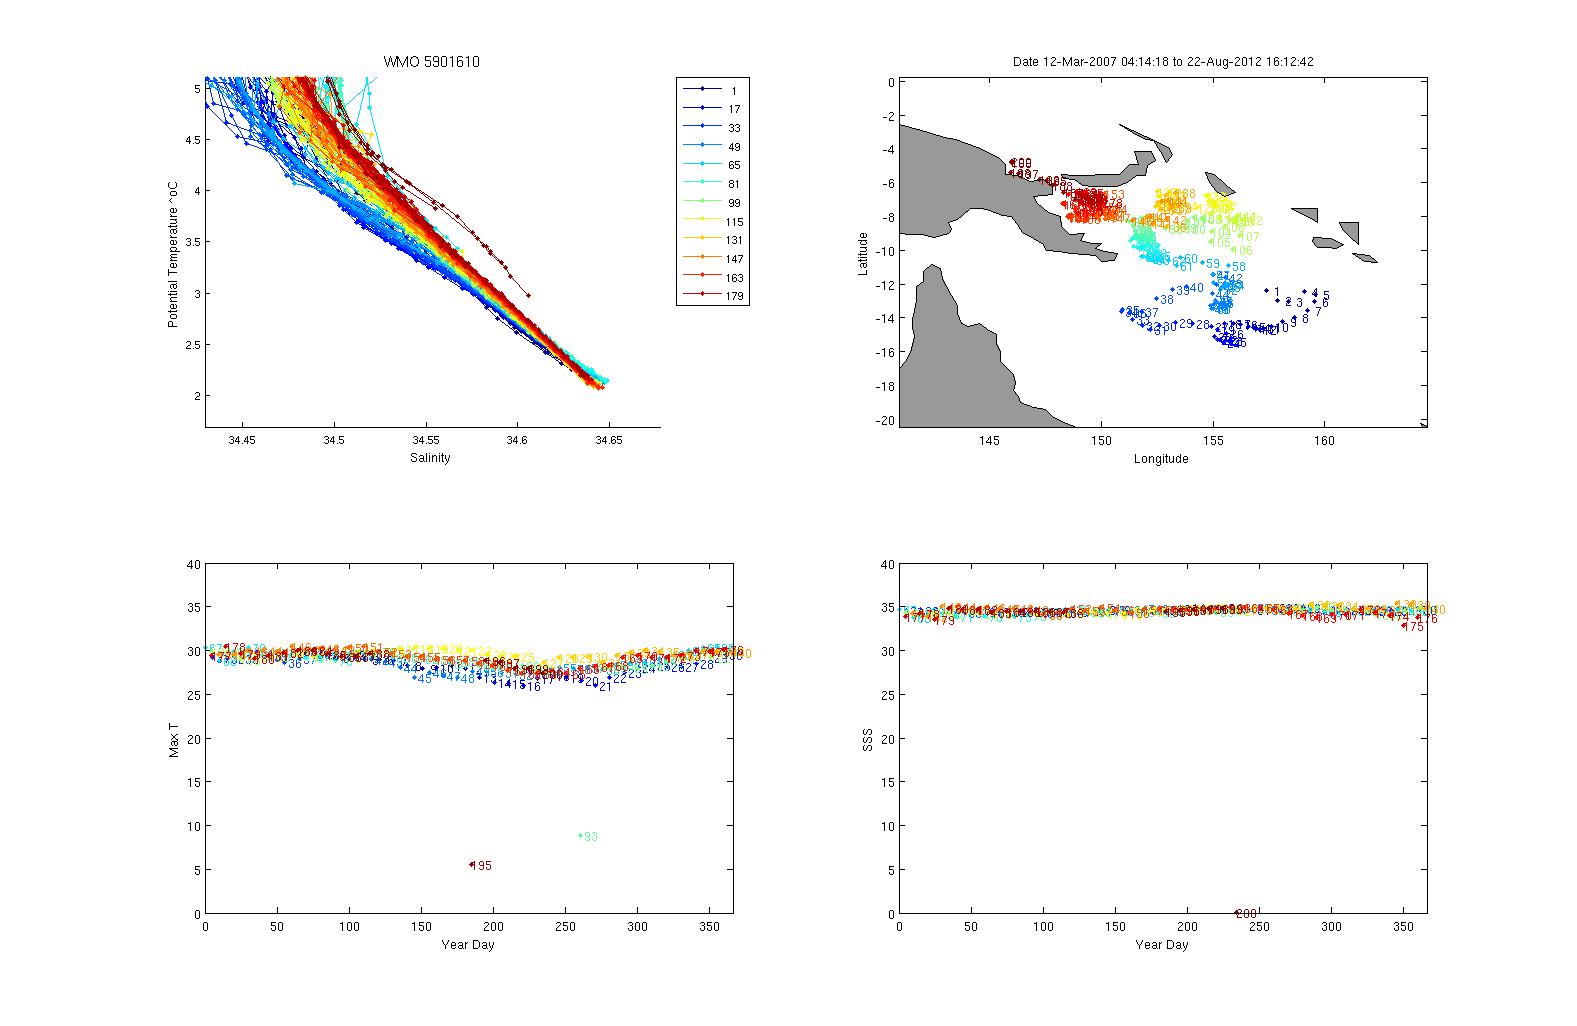
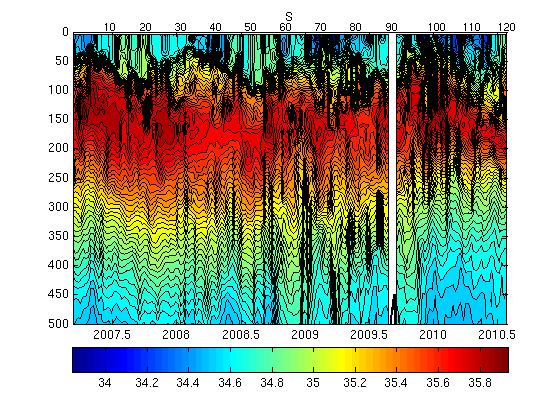
Potential Temperature-Salinity (a), Location (b, Max Temperature (c) and Sea Surface Salinity (d) plots located below.
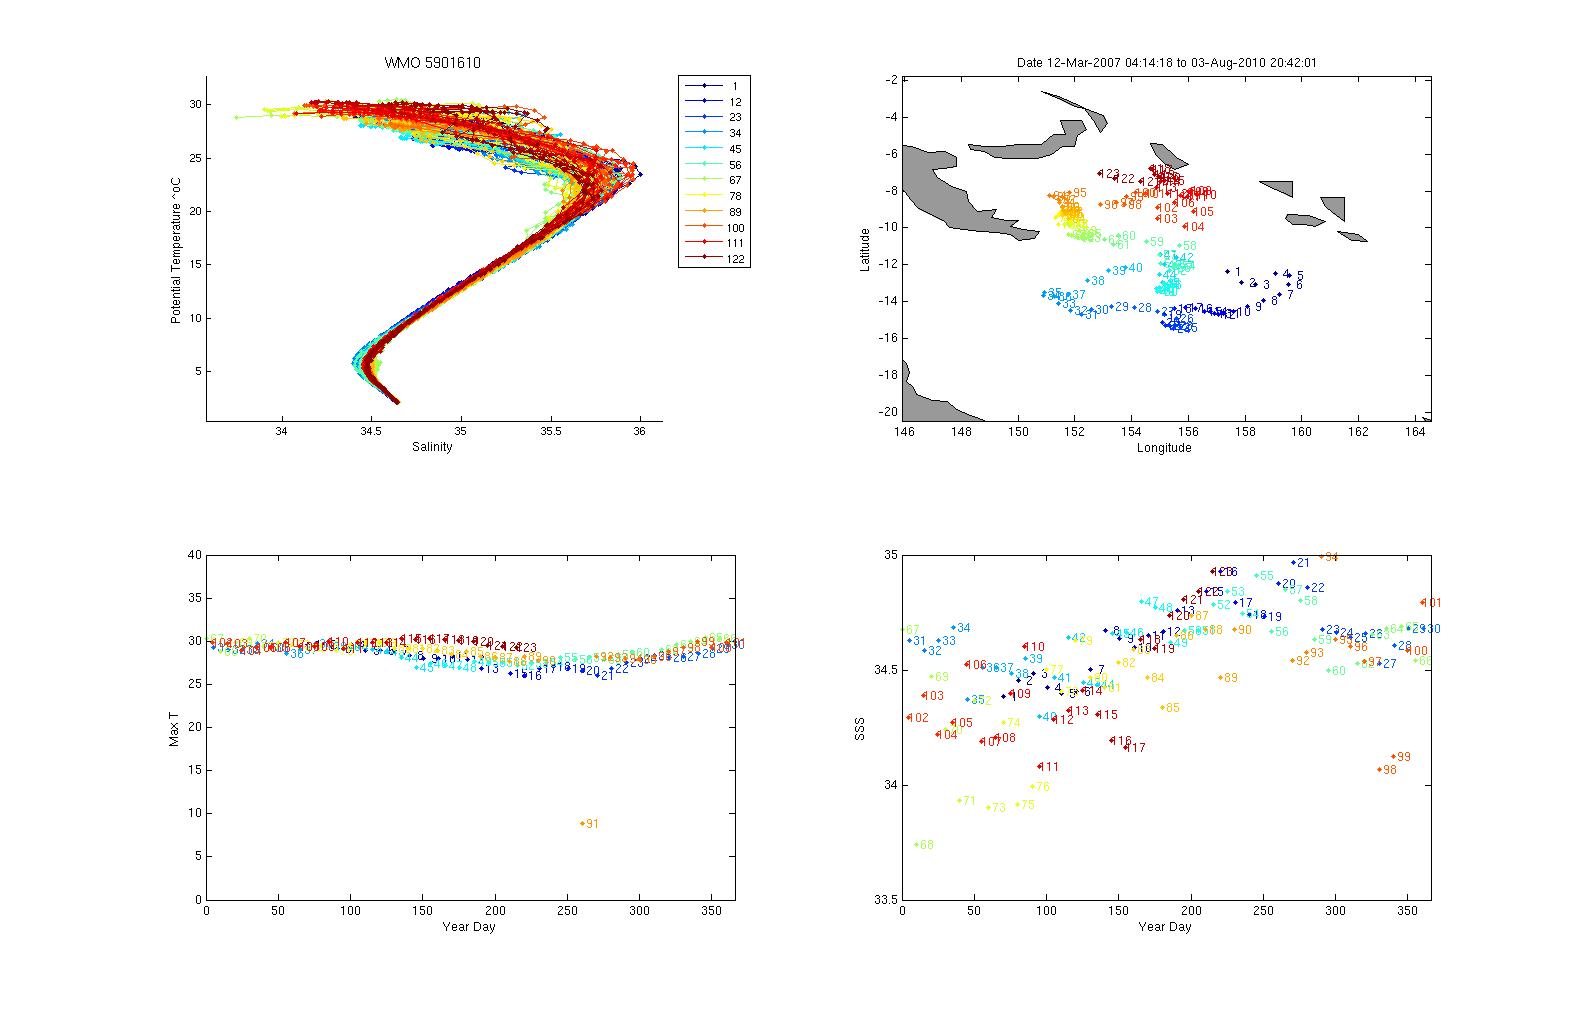
Surface temperatures generally varied between 26 and 31 şC and surface salinities from 34.3 to 35.0.
The plot below shows the potential-temperature/salinity relationship for the deepest theta levels where the relationship between the two parameters should show the least variation.
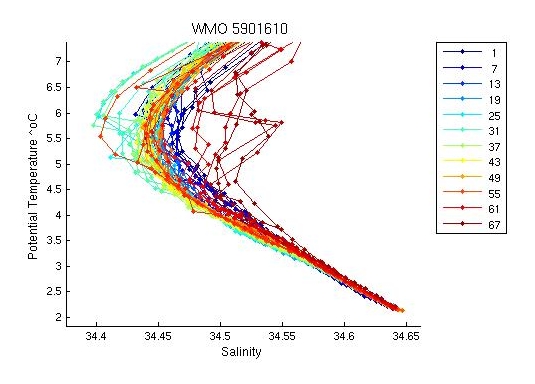
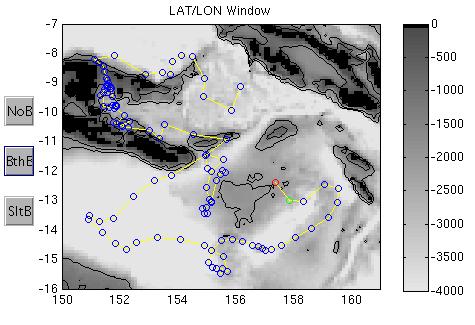
The profiles are generally well distributed. Although the first two profiles may suffer from TBTO. But when you look at the TS curve, it is only the very deepest section of the TS plot which shows that these two profiles are significantly fresh. If you look further up the TS curve these profiles are at the saltier end of the spectrum so if you correct for possible TBTO at depth then the rest of the curve will likely be out. If you look at the location of these profiles they are in a passage which connects two basins with potentially different deep water mass regimes which may account for the freshness? Later analysis shows that these two profiles may have touched the bottom (hence may have some fouling in the cell). Therefore QC the bottom values of these two profiles as QC=4. Some profiles show high salinity intrusions at the salinity minimum while others show low salinity intrusions. As these intrusions occur over multiple values and multiple profiles I am inclined to think that they are real.
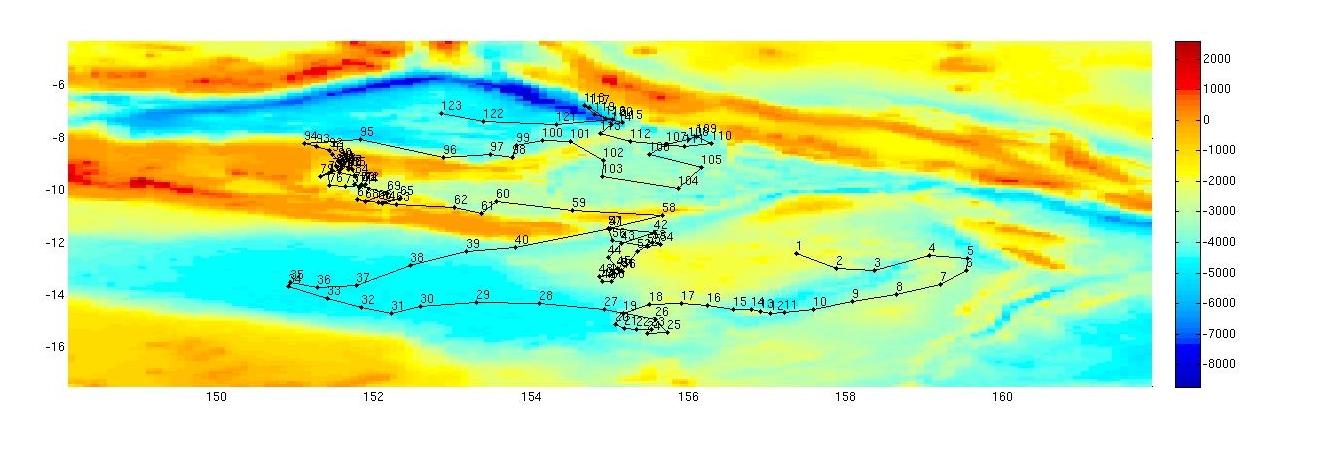
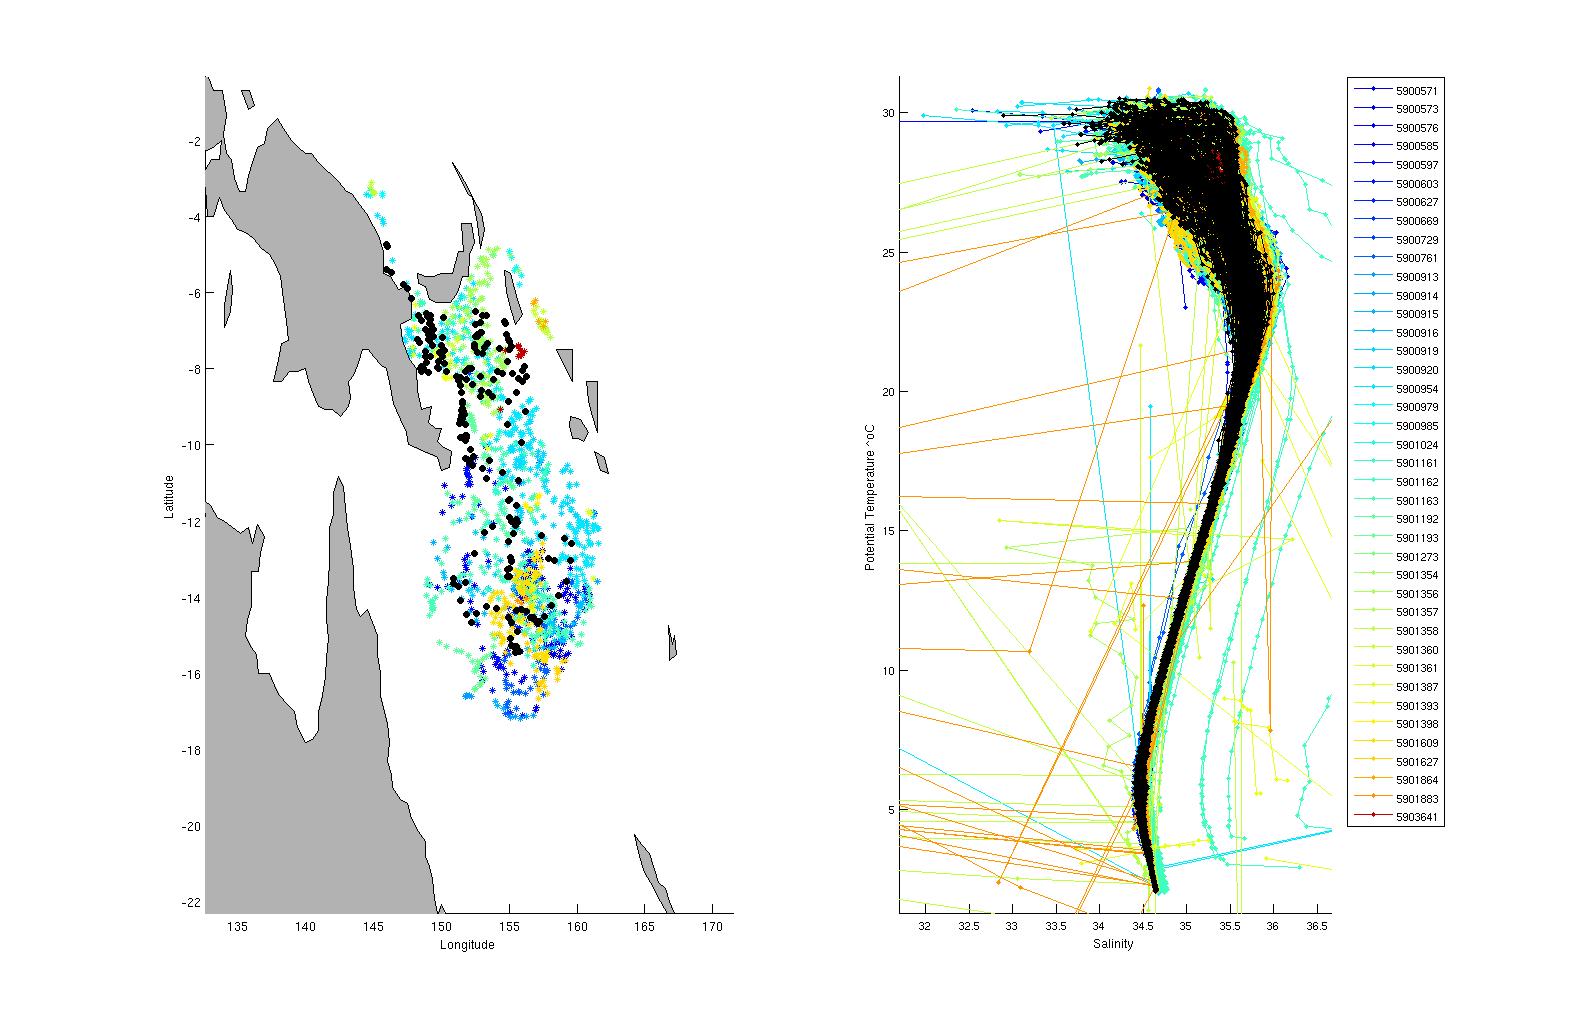
The two plots below show a). the location of this float (black circles) in relation to the position of other nearby argo floats (coloured circles) and b). The potential-temperature/salinity curve for this float (in black) compared to nearby argo floats (coloured).
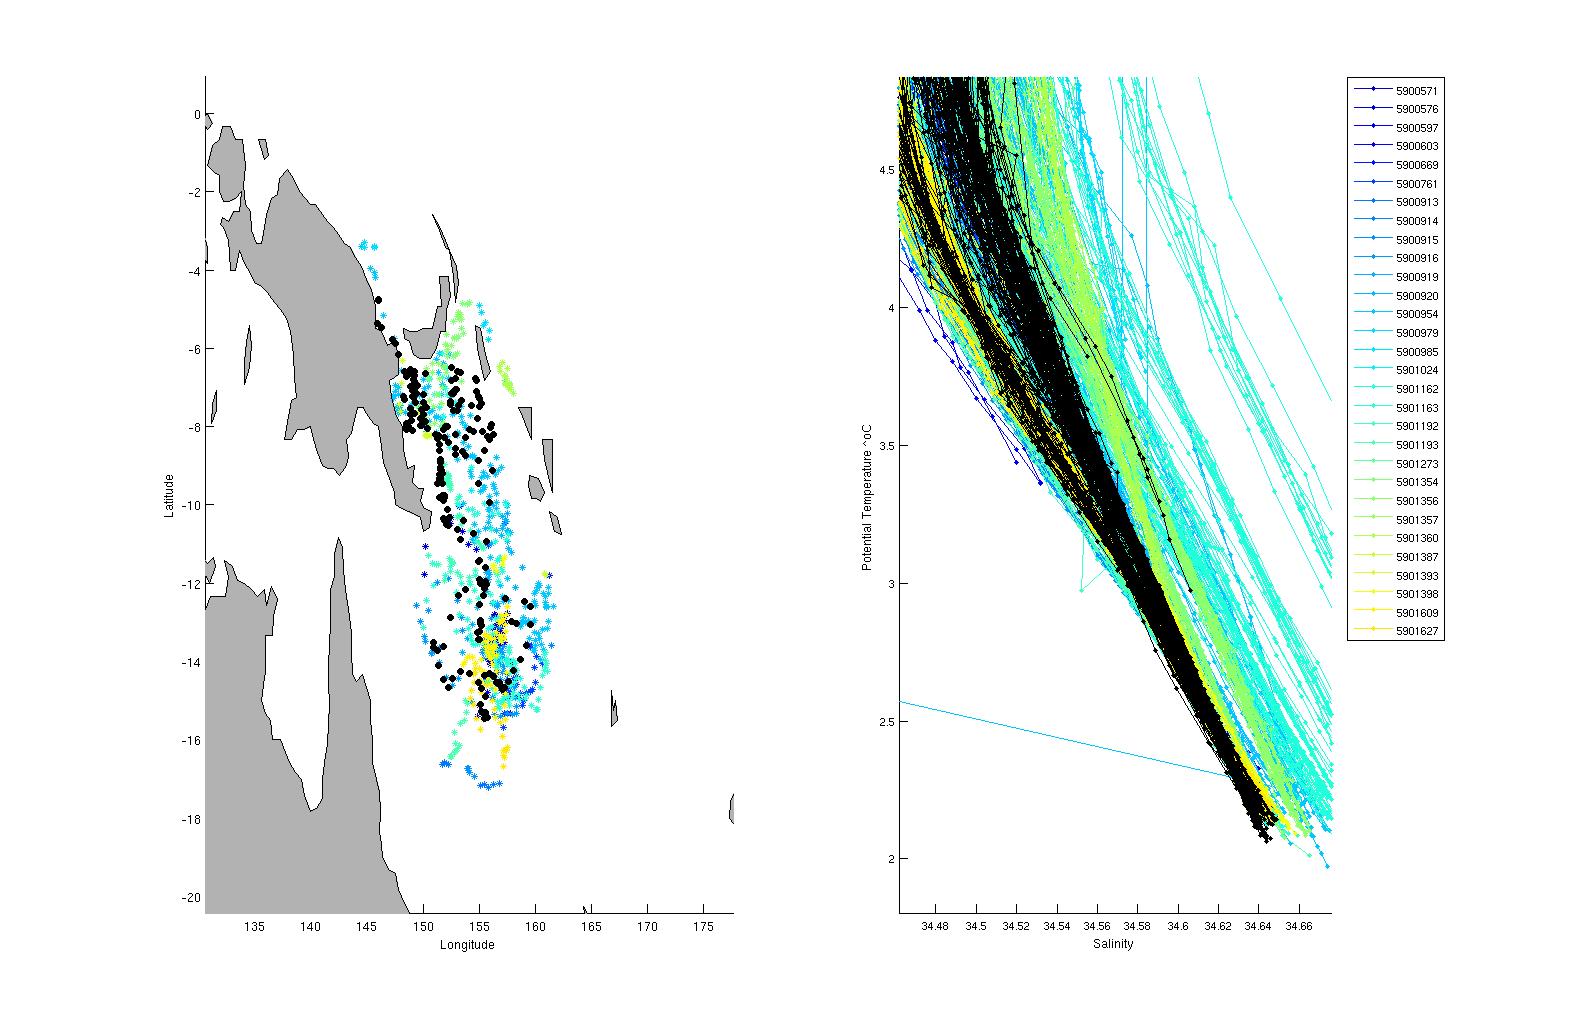
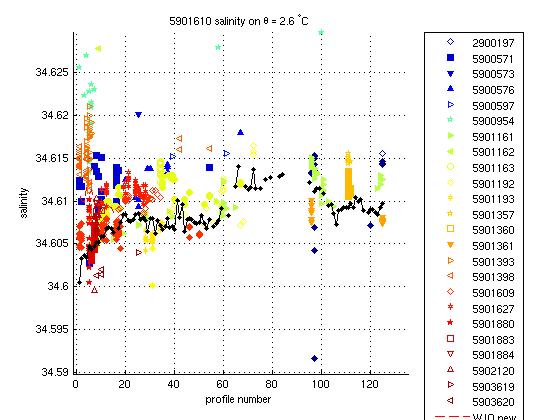
The potential-temperature/salinity relation for the deepest theta levels for this float (in black) and nearby argo floats (coloured) is displayed below.
There were inversions in profiles; 18 and 86. These were not significant and were not flagged.
Salt hooks were located in profiles; 5,7,9,11,13,21,22,25,27,29,33,35,37,39,41,43,45,48,51,53,55,60,61,62,69,70,71,72,73,74,75,97,98,99,100,101,102,103,104,106. These were flagged as QC 4 for both T & S.
There were no missing profiles. The float looks like it grounded on profiles 1, 2, 57, 58, 63, 64, 65 and 66. Some bad bottom values were flagged. There was a block of missing data in profile 16 from 1150 to 1450 m. Flagged the surface value of p 14 as bad for both T & S.
The plot below shows the analysis of salinity drift using the WJO/OW software.

The four plots below show the salinity anomalies on theta surfaces compared to (a) the Gouretski and Kolterman climatology, (b) the CARS (CSIRO Atlas of Regional Seas)/WOA (World Ocean Atlas) climatology, (c) the anomalies within the float series itself, (i.e. the salinity anomaly of each profile from the mean profile average for the float and (d) the raw float salinity compared to the CARS and G&K climatological salinity on a deep theta surface.
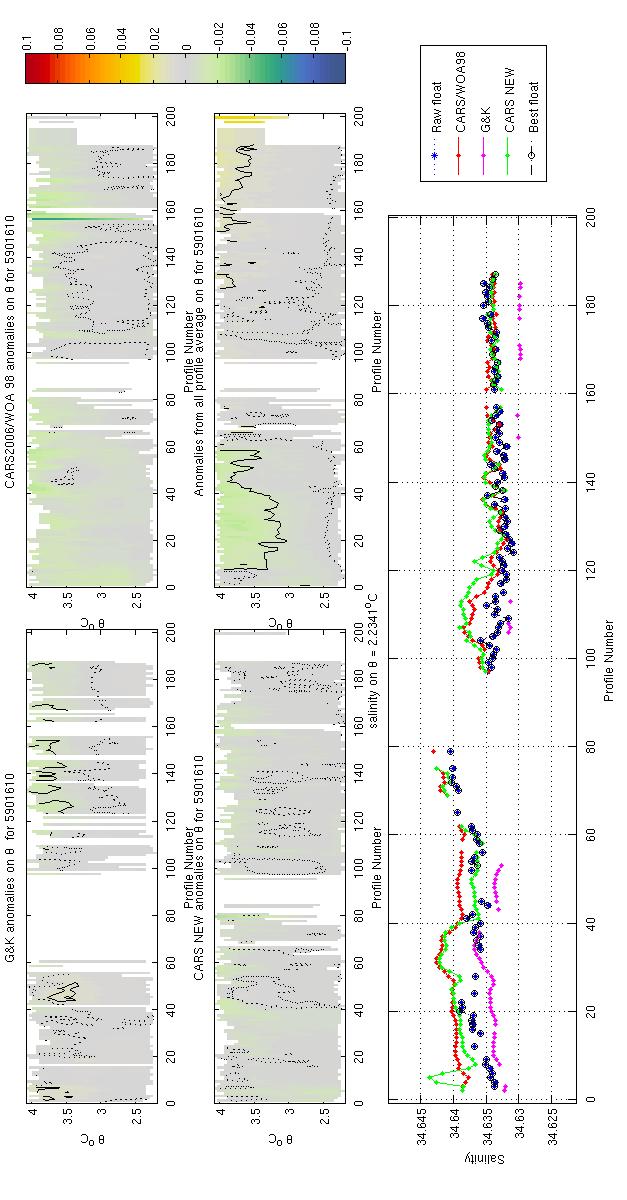
This float is very close to climatologies.
The plots below show the raw float salinity data (solid blue line) compared to neighbouring argo floats (coloured symbols) on a deep potential temperature surface. The locality map shows the location of the profiles for this float and for neighbouring floats.
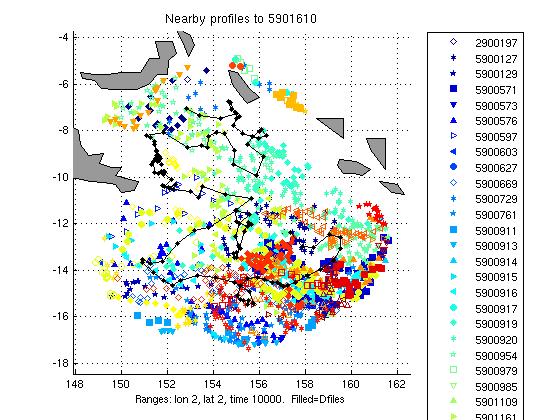
The float is in the middle of the data envelope.
This float required no salinity drift correction.
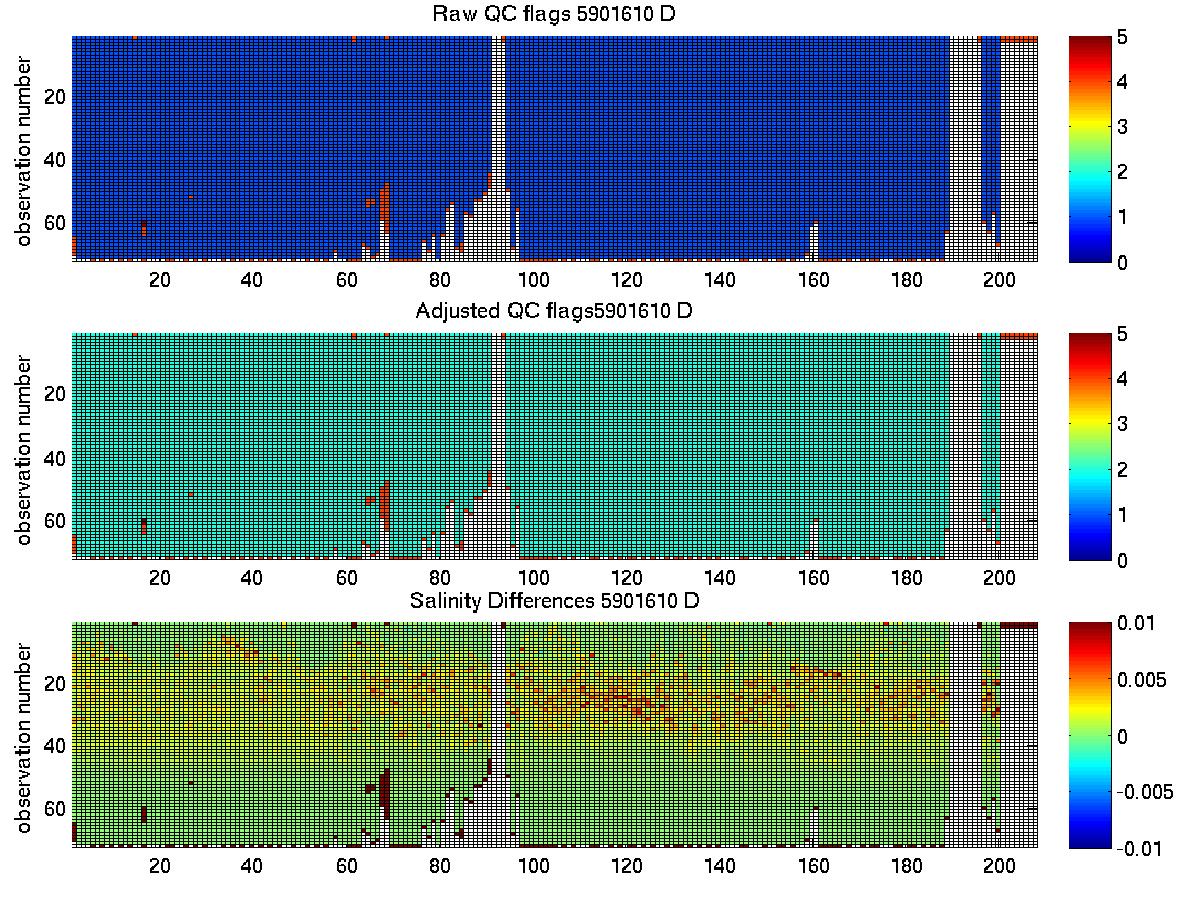
The plot below summarises the QC flags and salinity differences for the raw and adjusted salinity fields in the final delayed mode files submitted to the GDAC.
Created 12-08-2010