The table below provides basic information about the float, including primary sensors, mission parameters and current status of profiles.
| Institute | CSIRO |
| Principal Investigator | Susan Wijffels |
| Pressure Sensor | Druck (serial number=10266) |
| CTD Sensor | APEX-SBE-41 (serial number=3006) |
| CTD Sampling Mode | Burst Sampler |
| Controller Board | APF 8 |
| Additional Sensors/Software | None |
| Park Depth | 1000 m |
| Profile Depth | 2000 m |
| Launch Date | 11-03-2007 |
| Number of D-moded Profiles | 107 |
| Calibration Date | 13-08-2010 |
| Pressure Drift | Surface Pressure Offset corrected |
| Salinity Drift | No salinity drift detected |
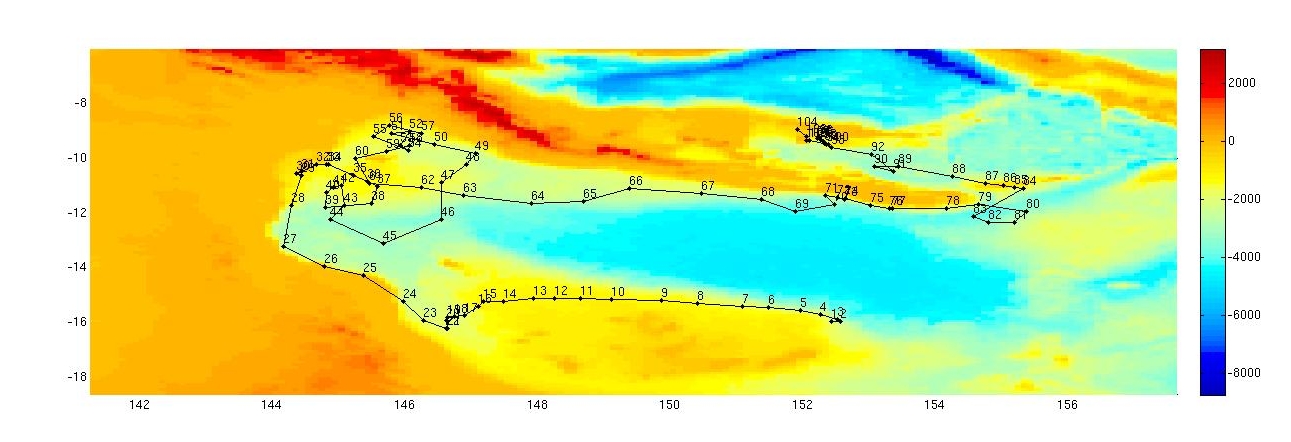
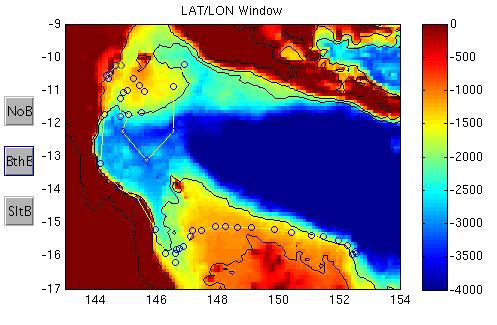
This float was located in the Coral Sea just off the north-eastern tip of Australia, in a region bounded by 144 to 153 şE and 8 to 16 şS.
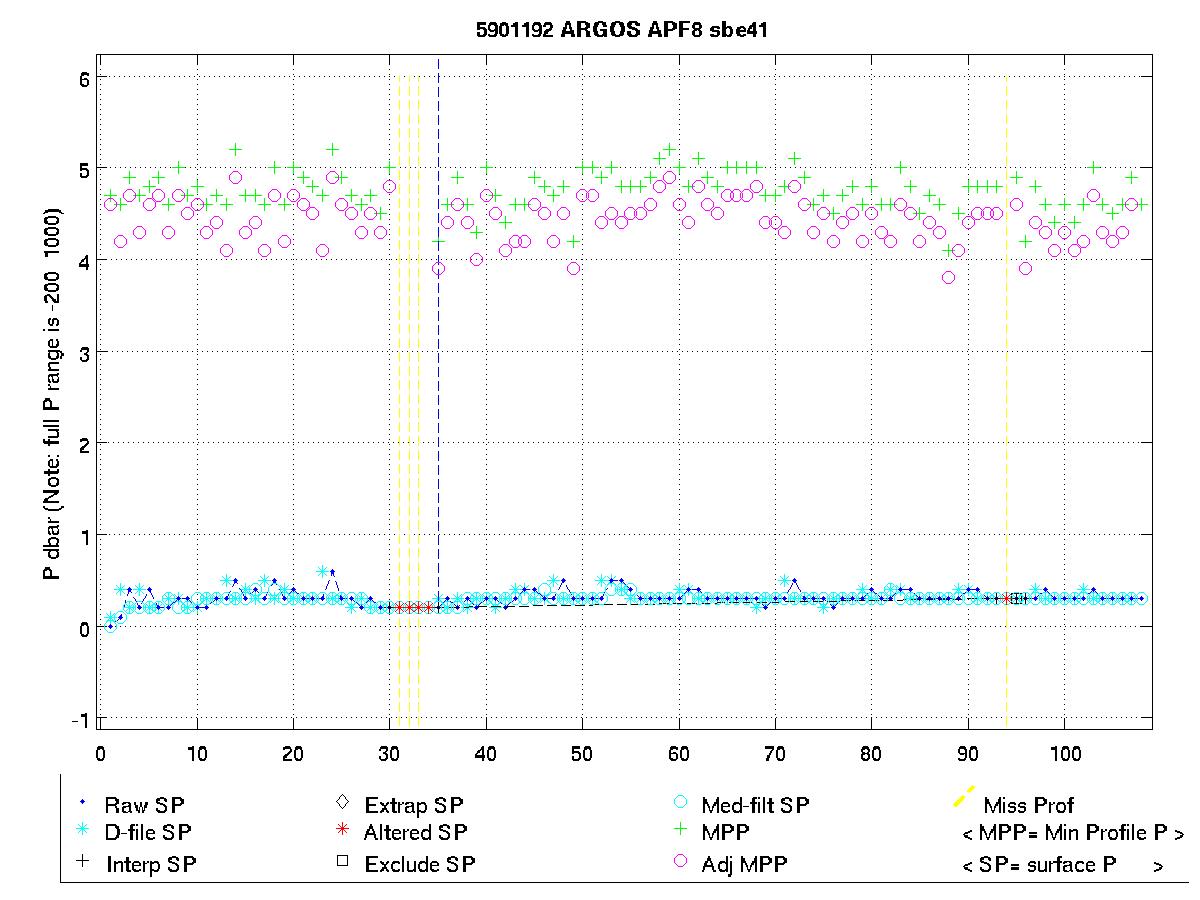
The surface pressure for this float is shown in the plot below.
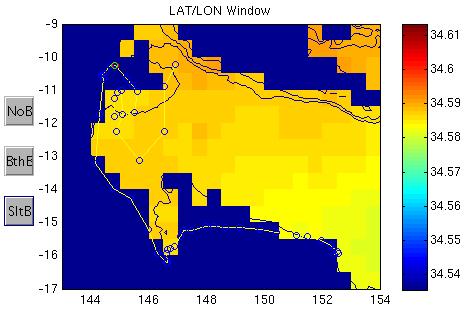
Potential Temperature-Salinity (a), Location (b, Max Temperature (c) and Sea Surface Salinity (d) plots located below.
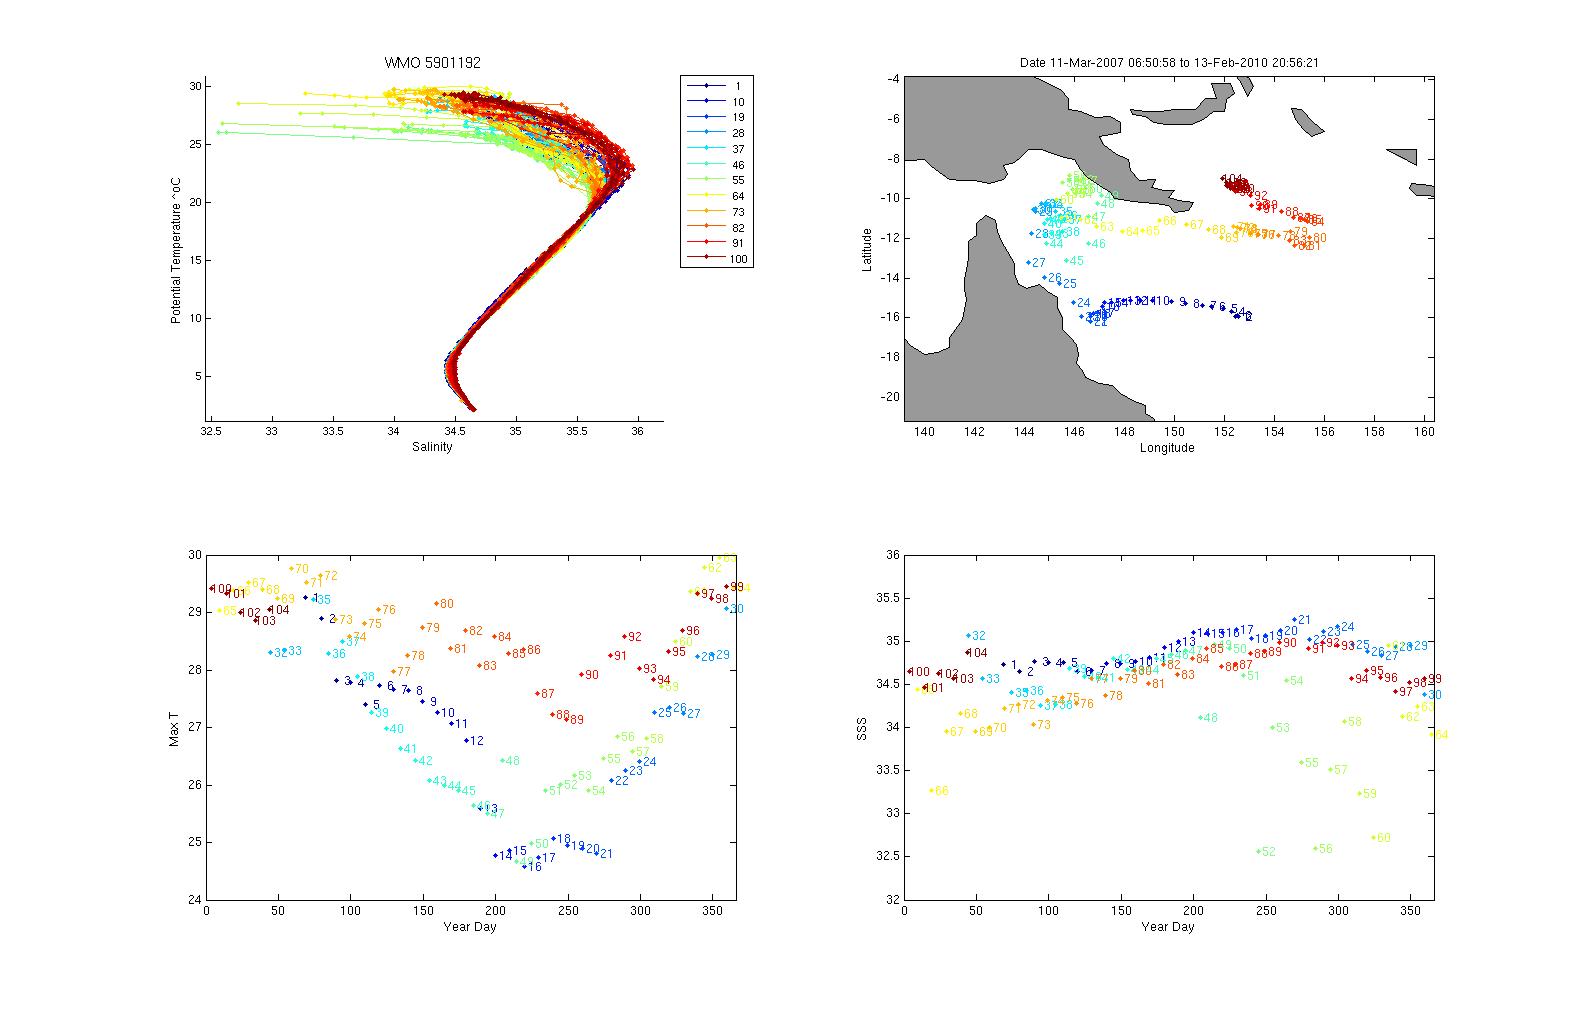
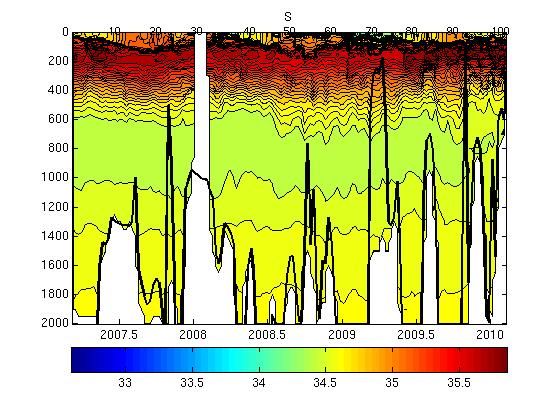
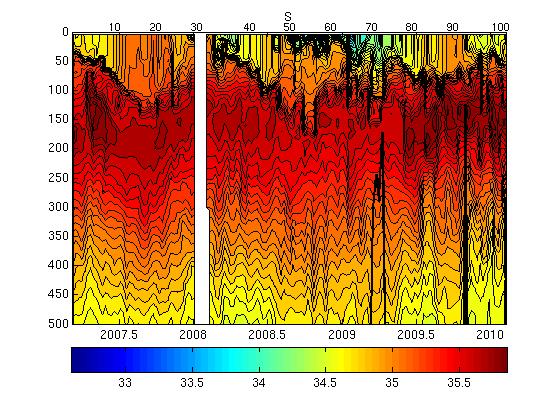
Surface temperatures generally varied between 24 and 30 şC and surface salinities from 32.5 to 35.2.
The plot below shows the potential-temperature/salinity relationship for the deepest theta levels where the relationship between the two parameters should show the least variation.
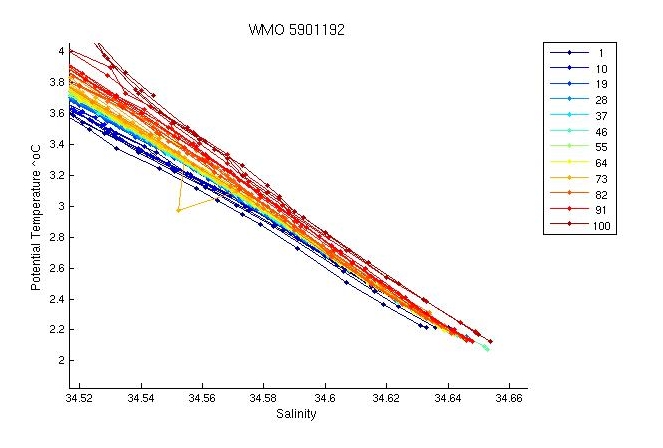
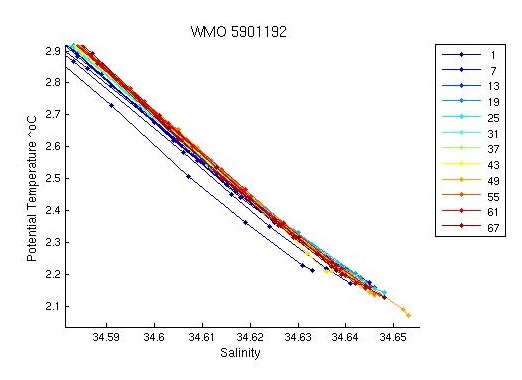
The profiles are generally well distributed throughout the water column. Some of the latest profiles just south of Papua New Guinea show very low surface salinity values. This might be caused by the float sampling low salinity lenses after tropical downpours. The deep profiles for this float are tightly distributed with the exception of profiles; 1 and 31, which lie outside the envelope. It also appears that there might be TBTO fouling affecting the first few profiles.
The two plots below show a). the location of this float (black circles) in relation to the position of other nearby argo floats (coloured circles) and b). The potential-temperature/salinity curve for this float (in black) compared to nearby argo floats (coloured).
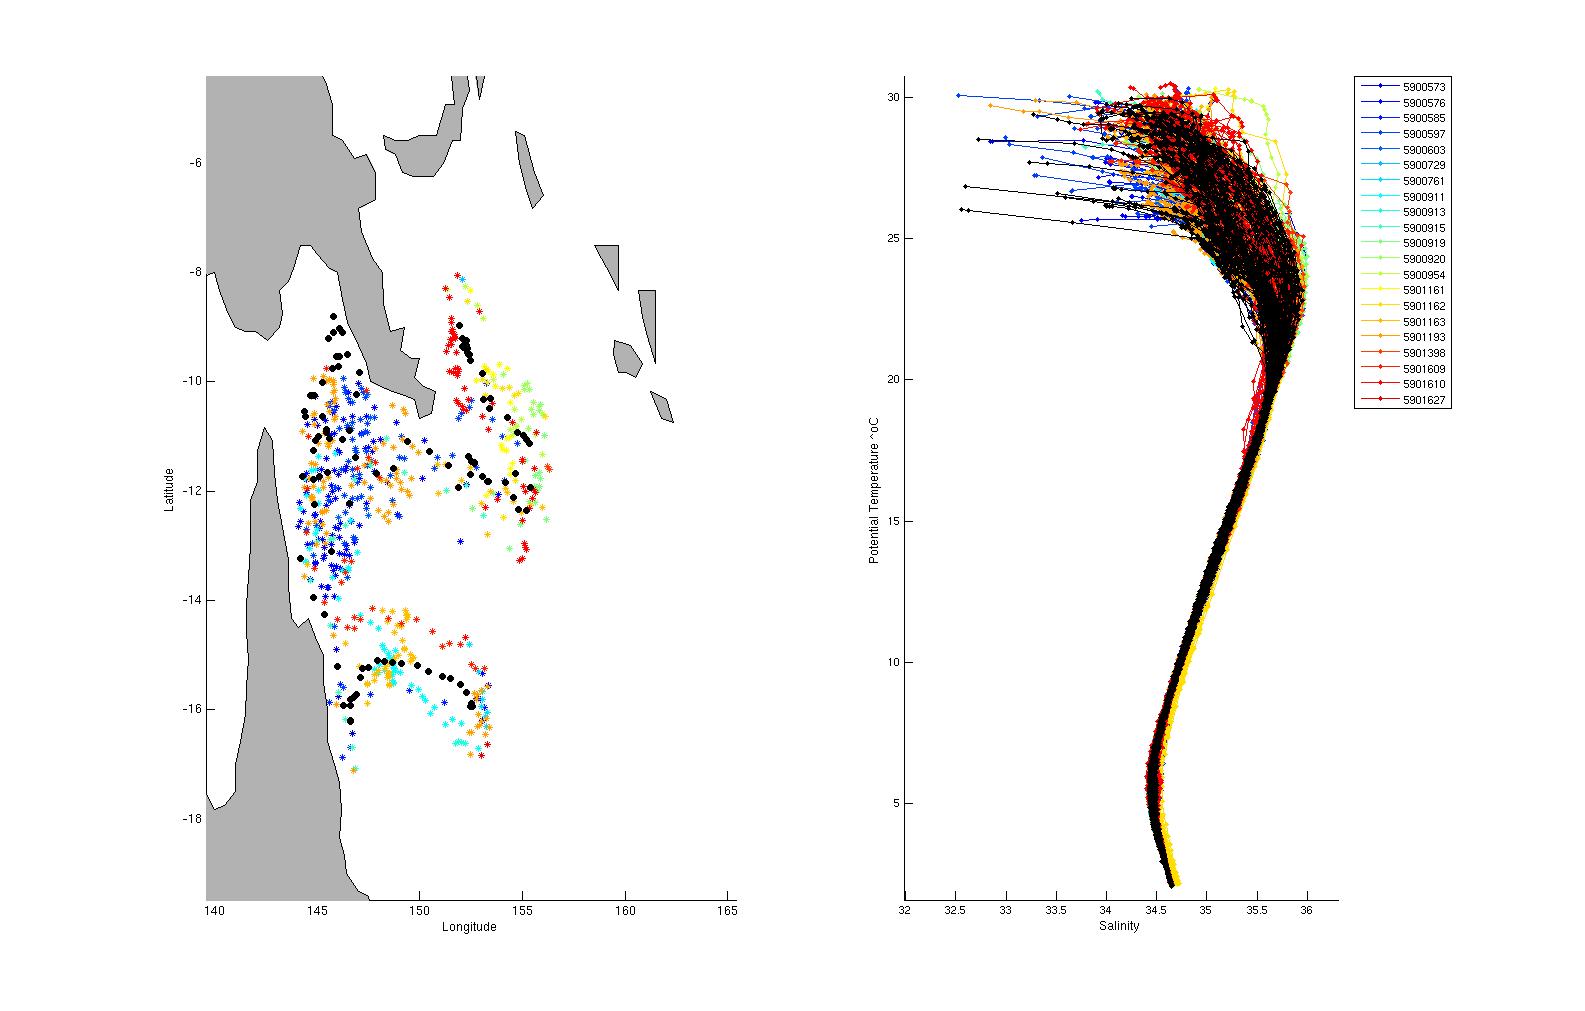
The potential-temperature/salinity relation for the deepest theta levels for this float (in black) and nearby argo floats (coloured) is displayed below.
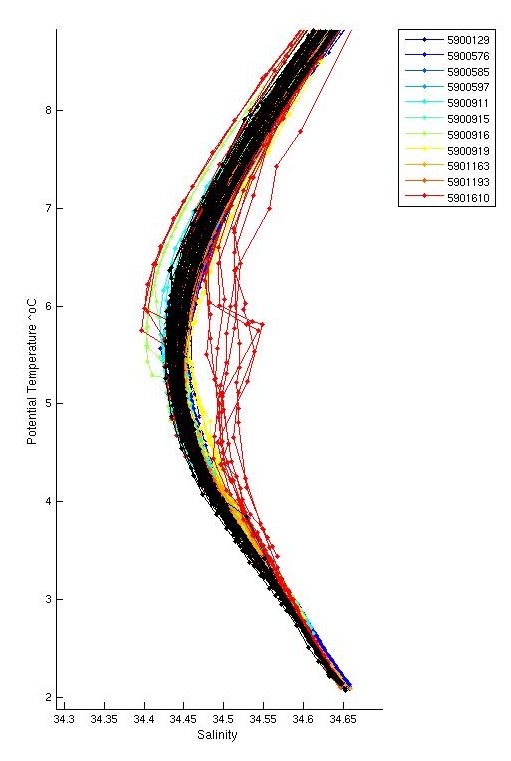
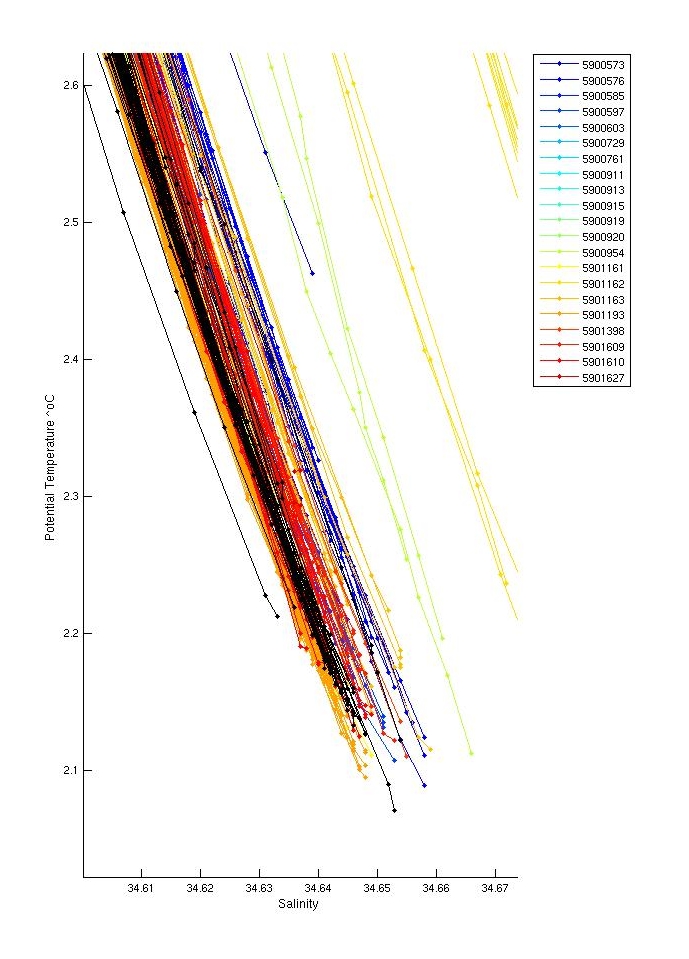
The profiles for this float are located within the middle of the envelope of profiles. At depth the profiles are at the fresher end of the envelope.
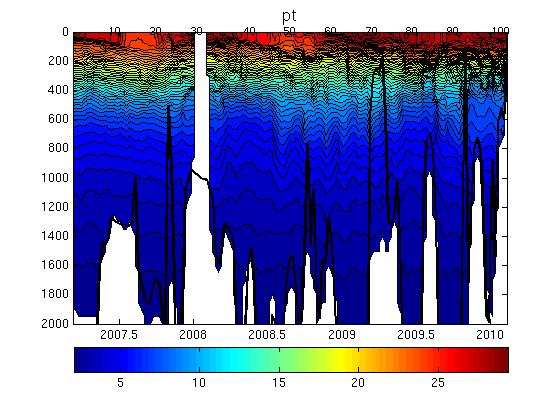
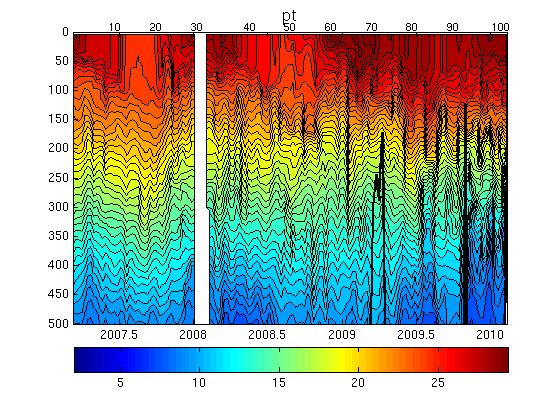
There was one inversion for this float in profile 13 at 15 m depth which was flagged as bad. There is missing data in profile 13 at 90 - 110m depth.
Salt hooks were located in profiles; 4,6,24,27,42,47,48,49,51,52,57,66,67,68,69,70,72,73,83,84,85,86,91,92,93,95,96,98. These were flagged as QC 4 for both T & S.
The float grounded on numerous profiles. Profiles 32 and 33 are missing. Profile 31 had only 2 data points in the profile, both of these were flagged as bad. Profile 34 had very low values at the surface, these may be real check next time around with more data. Need to correct TBTO for first few profiles.
The plot below shows the analysis of salinity drift using the WJO/OW software.

This float requires no correction.
The four plots below show the salinity anomalies on theta surfaces compared to (a) the Gouretski and Kolterman climatology, (b) the CARS (CSIRO Atlas of Regional Seas)/WOA (World Ocean Atlas) climatology, (c) the anomalies within the float series itself, (i.e. the salinity anomaly of each profile from the mean profile average for the float and (d) the raw float salinity compared to the CARS and G&K climatological salinity on a deep theta surface.
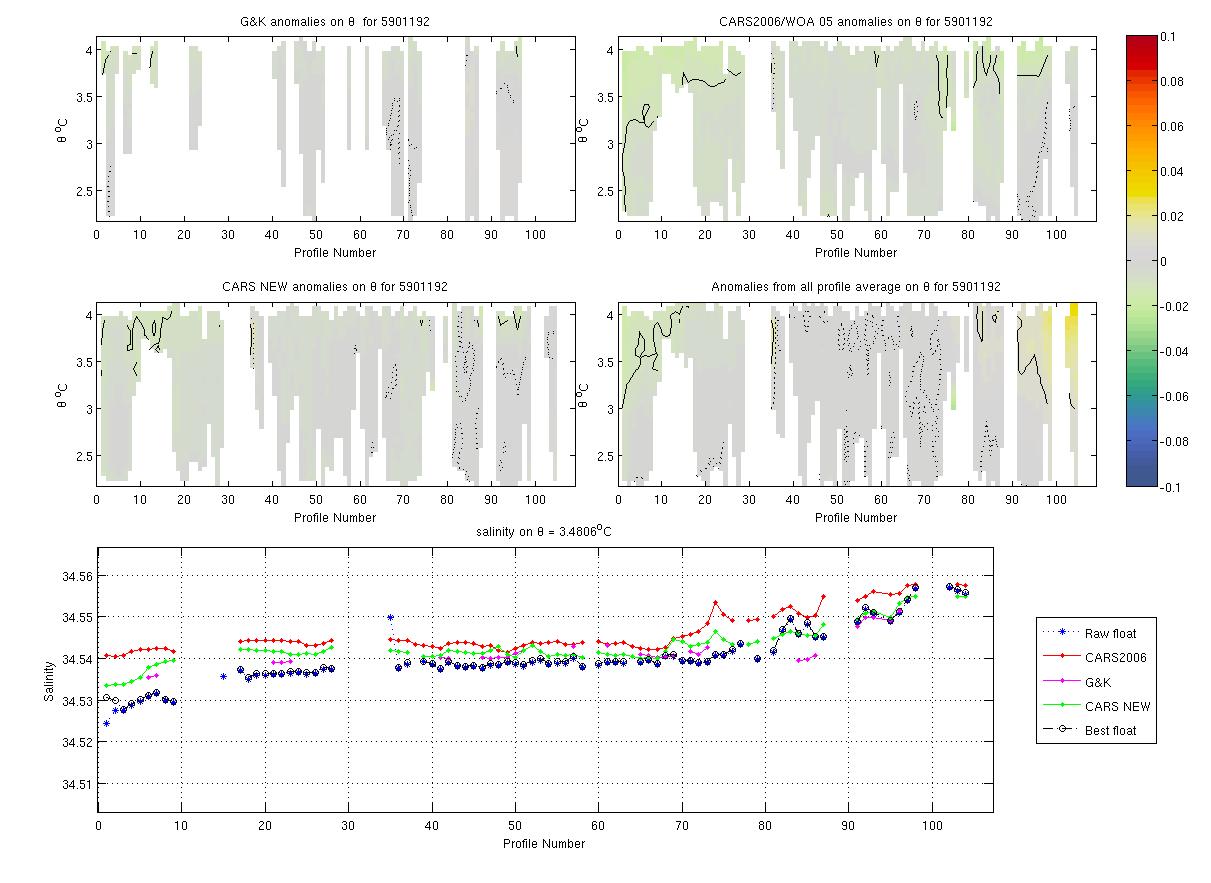
Float is reasonably close to climatologies. Has TBTO offset for the first two profiles.
The plots below show the raw float salinity data (solid blue line) compared to neighbouring argo floats (coloured symbols) on a deep potential temperature surface. The locality map shows the location of the profiles for this float and for neighbouring floats.
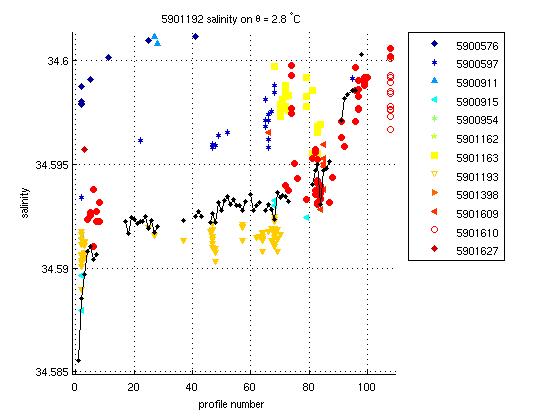
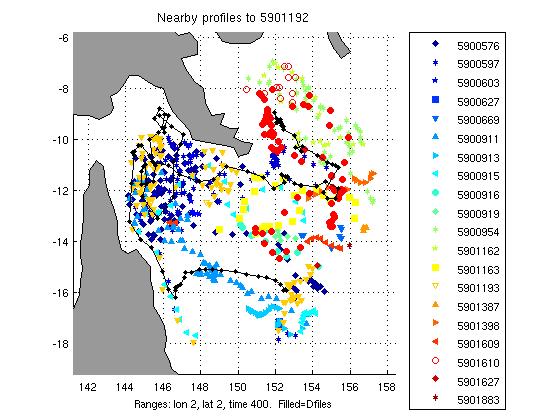
There are not many floats to compare this one to. However it is similar to float 5901193 which was deployed at the same time and is within the envelope of nearby argo floats.
This float required no salinity drift correction.
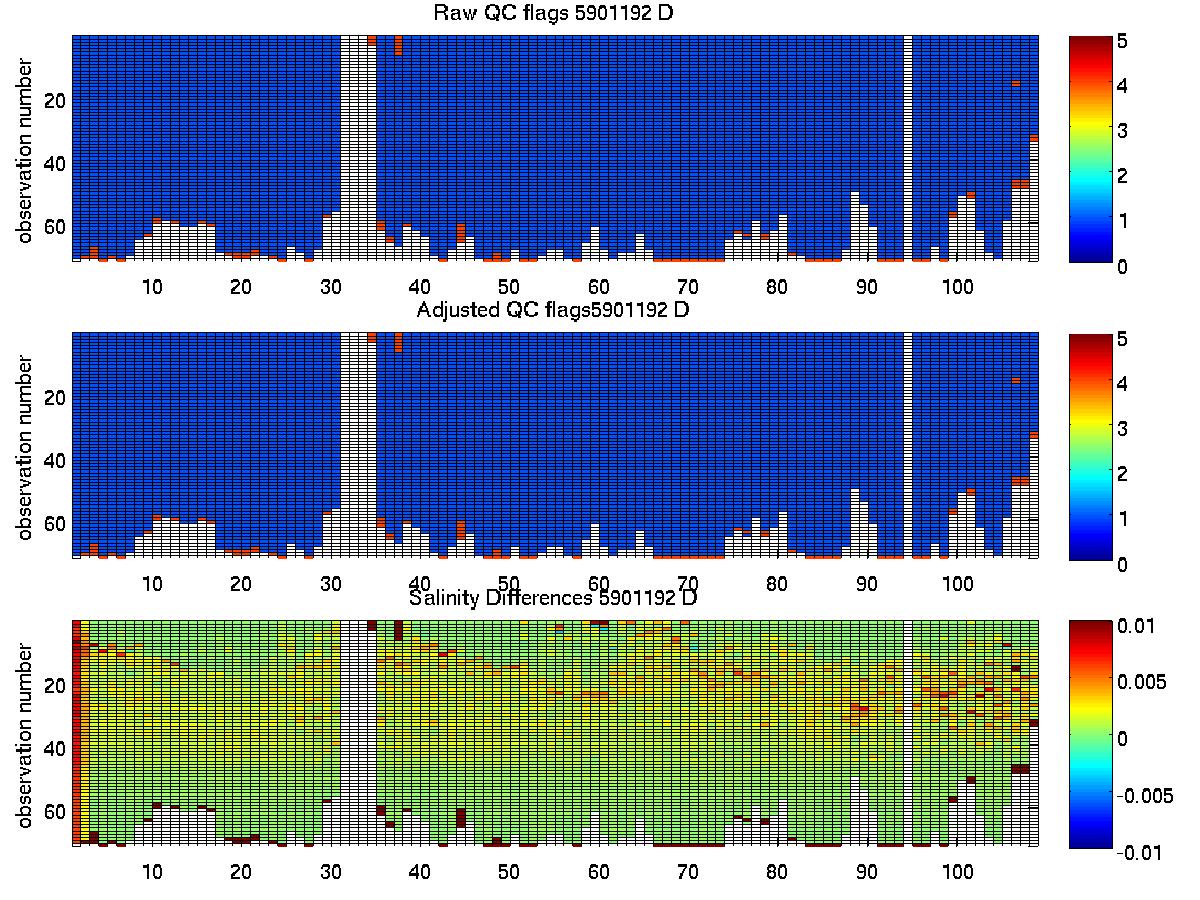
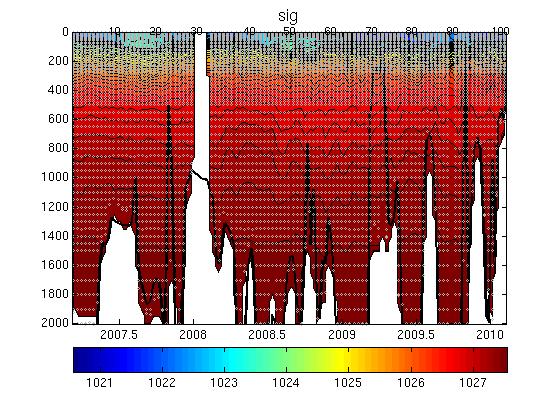
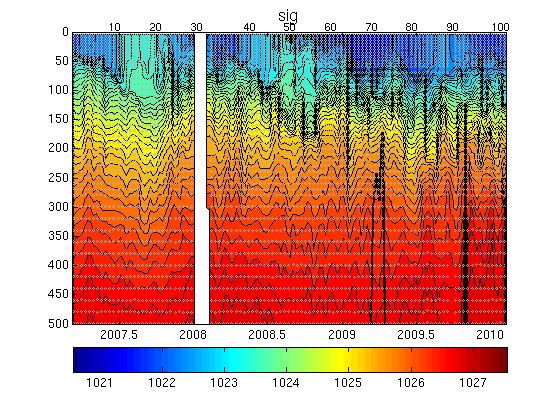
The plot below summarises the QC flags and salinity differences for the raw and adjusted salinity fields in the final delayed mode files submitted to the GDAC.
Created 13-08-2010