The table below provides basic information about the float, including primary sensors, mission parameters and current status of profiles.
| Institute | CSIRO |
| Principal Investigator | Susan Wijffels |
| Pressure Sensor | Druck (serial number=2341334) |
| CTD Sensor | APEX-SBE-41 (serial number=3104) |
| CTD Sampling Mode | Burst Sampler |
| Controller Board | APF 8 |
| Additional Sensors/Software | Aanderaa Oxygen Optode 3830 (serial number=721) |
| Park Depth | 1000 m |
| Profile Depth | 2000 m |
| Launch Date | 17-02-2007 |
| Number of D-moded Profiles | 109 |
| Calibration Date | 16-08-2010 |
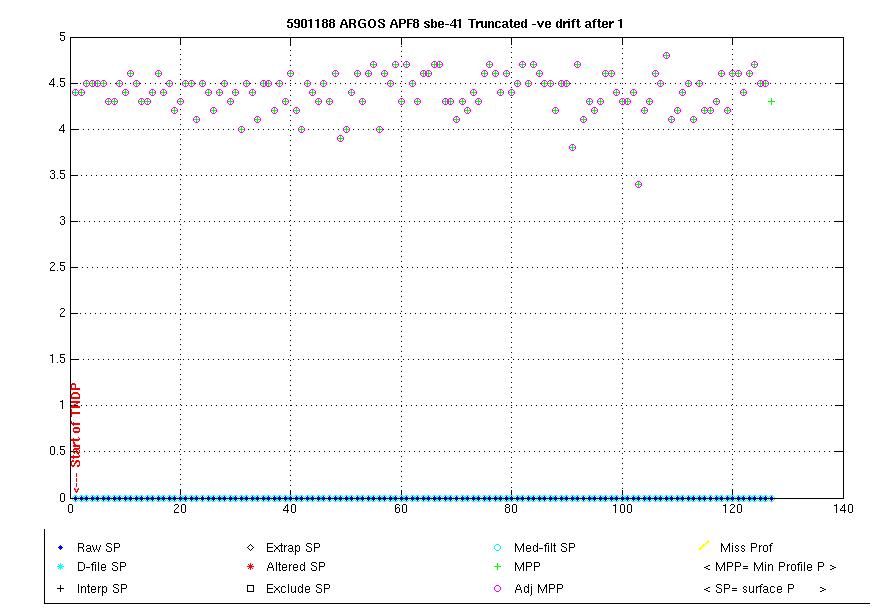
| Pressure Drift | Surface Pressure Offset unknown and uncorrectable from profile 1 onwards, TNDP float, no anomalous TS data, QC=2, serial number > 2324175 |
| Salinity Drift | No salinity drift detected |
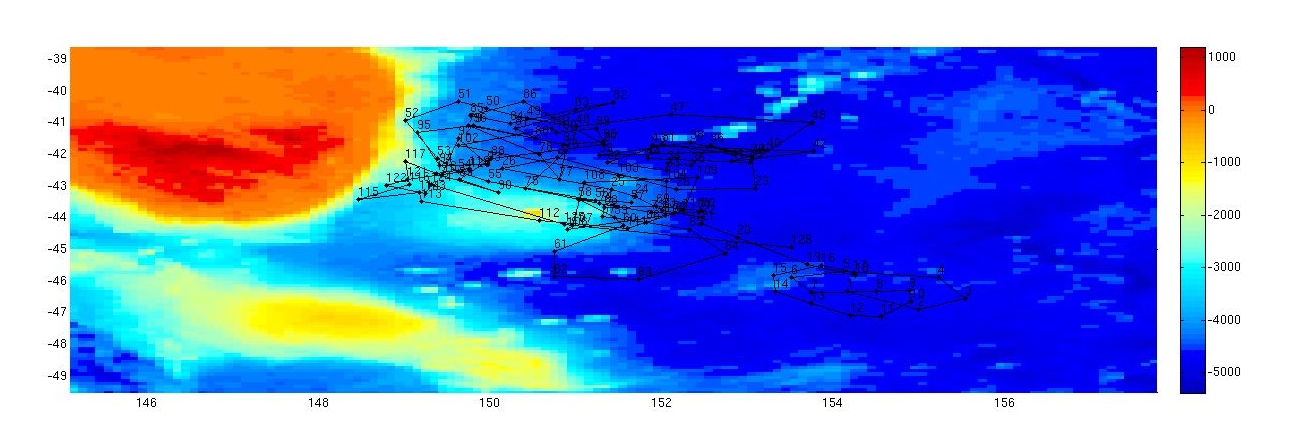
This float was deployed in the Tasman Sea to the east of Tasmania, in a region bounded by 149 to 155 şE and 40 to 47 şS.
The surface pressure for this float is shown in the plot below.
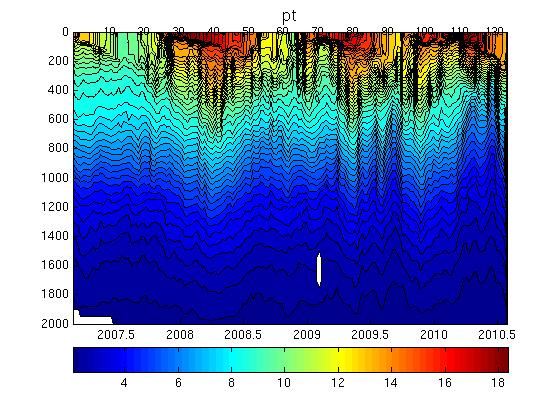
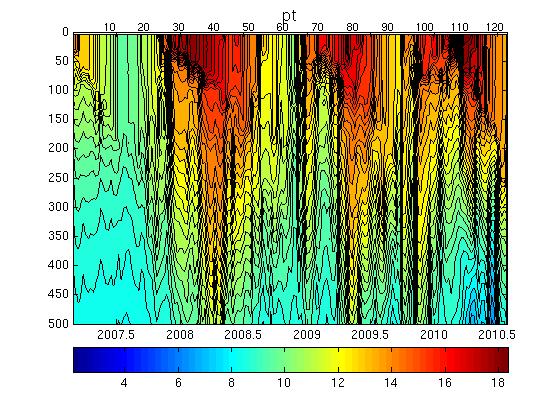
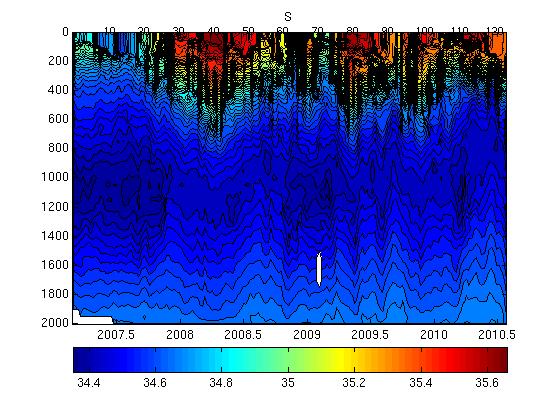
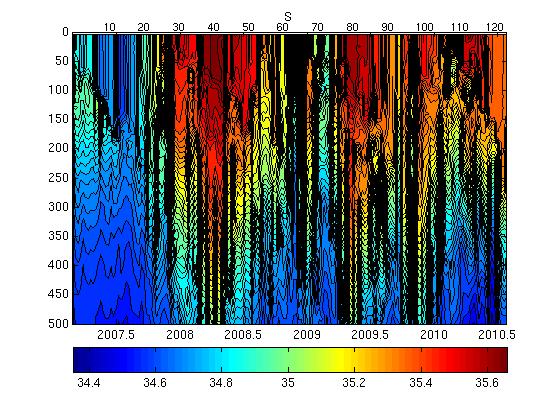
Potential Temperature-Salinity (a), Location (b, Max Temperature (c) and Sea Surface Salinity (d) plots located below.
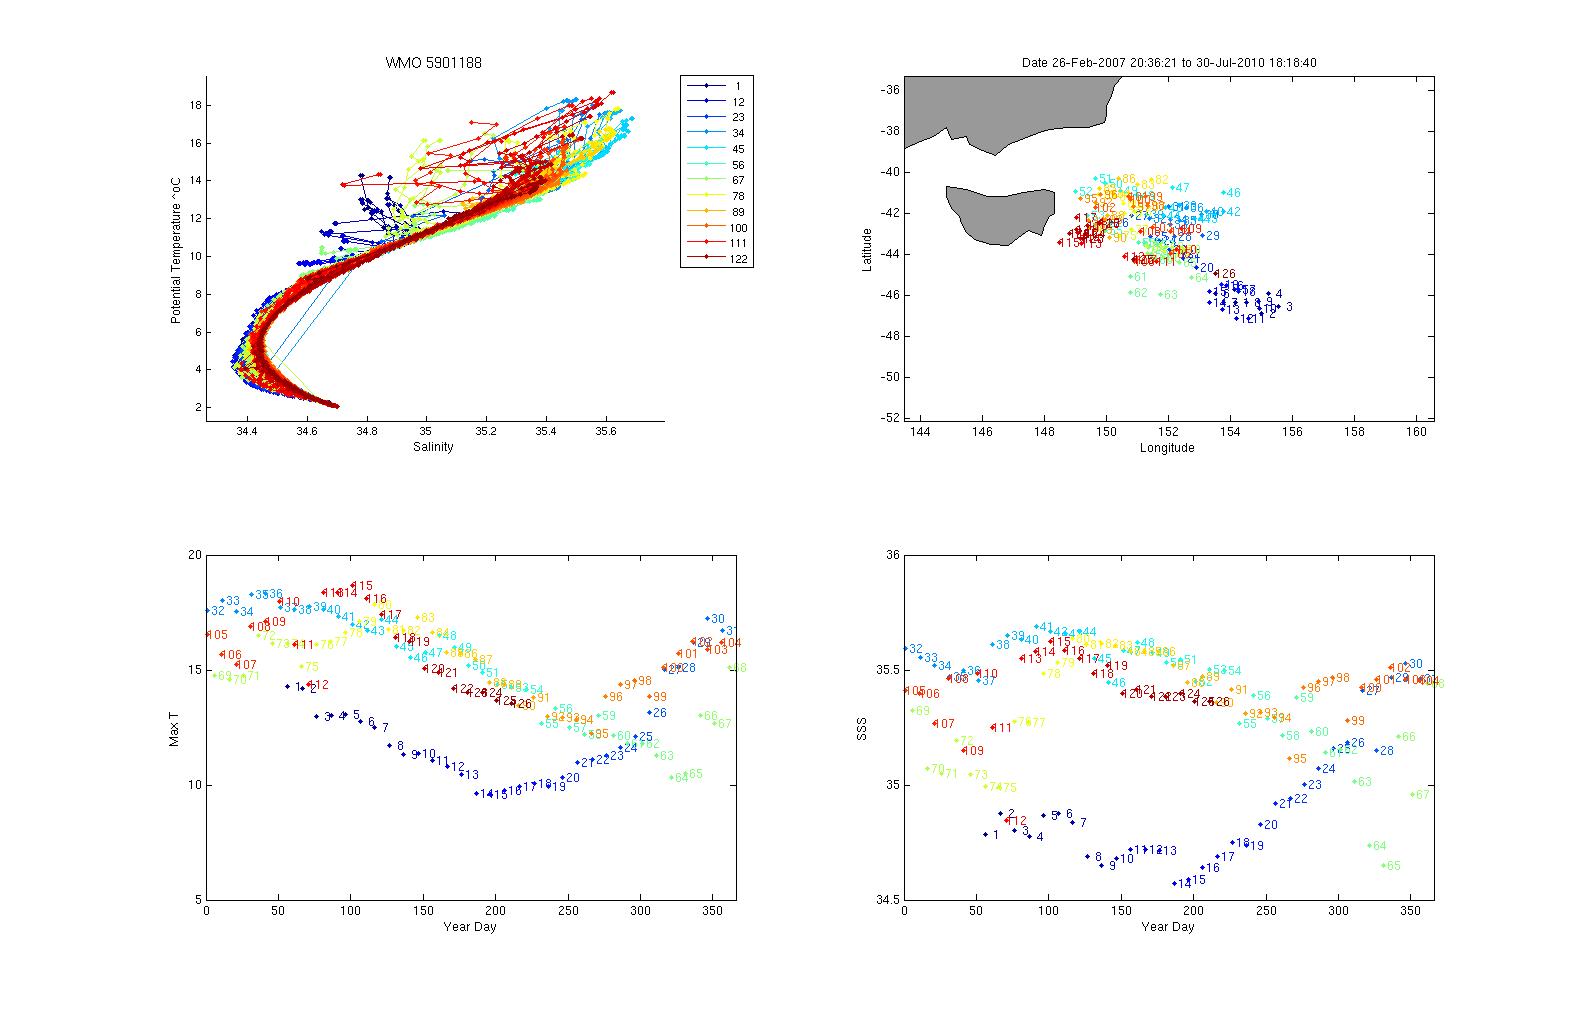
Surface temperatures generally varied between 9 and 19 şC and surface salinities from 34.5 to 35.8.
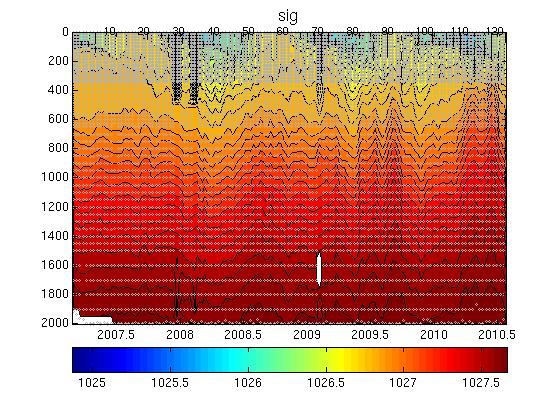
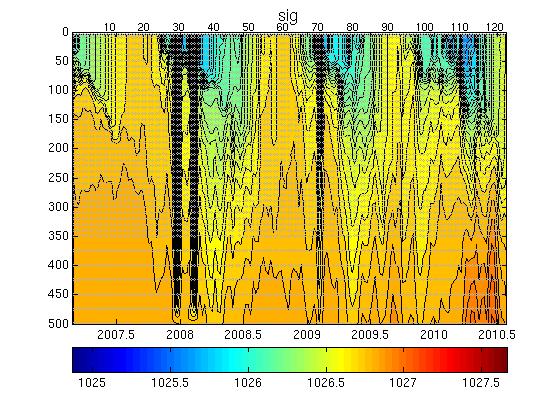
The plot below shows the potential-temperature/salinity relationship for the deepest theta levels where the relationship between the two parameters should show the least variation.
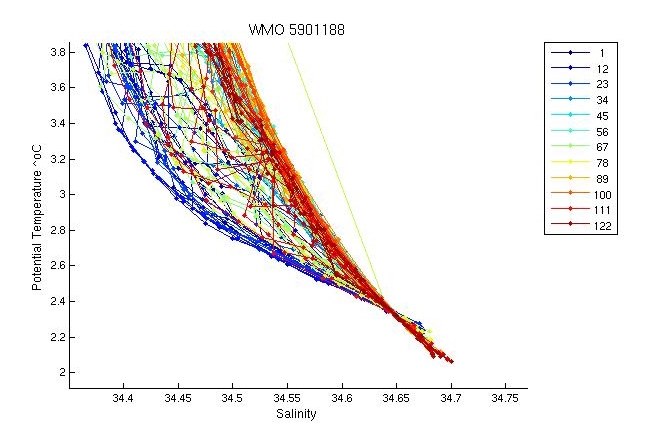
Profiles look reasonable. At depth there is spread in the profiles. The earlier profiles are significantly fresher at depth than later profiles but this looks fine given the path of the float.
The two plots below show a). the location of this float (black circles) in relation to the position of other nearby argo floats (coloured circles) and b). The potential-temperature/salinity curve for this float (in black) compared to nearby argo floats (coloured).
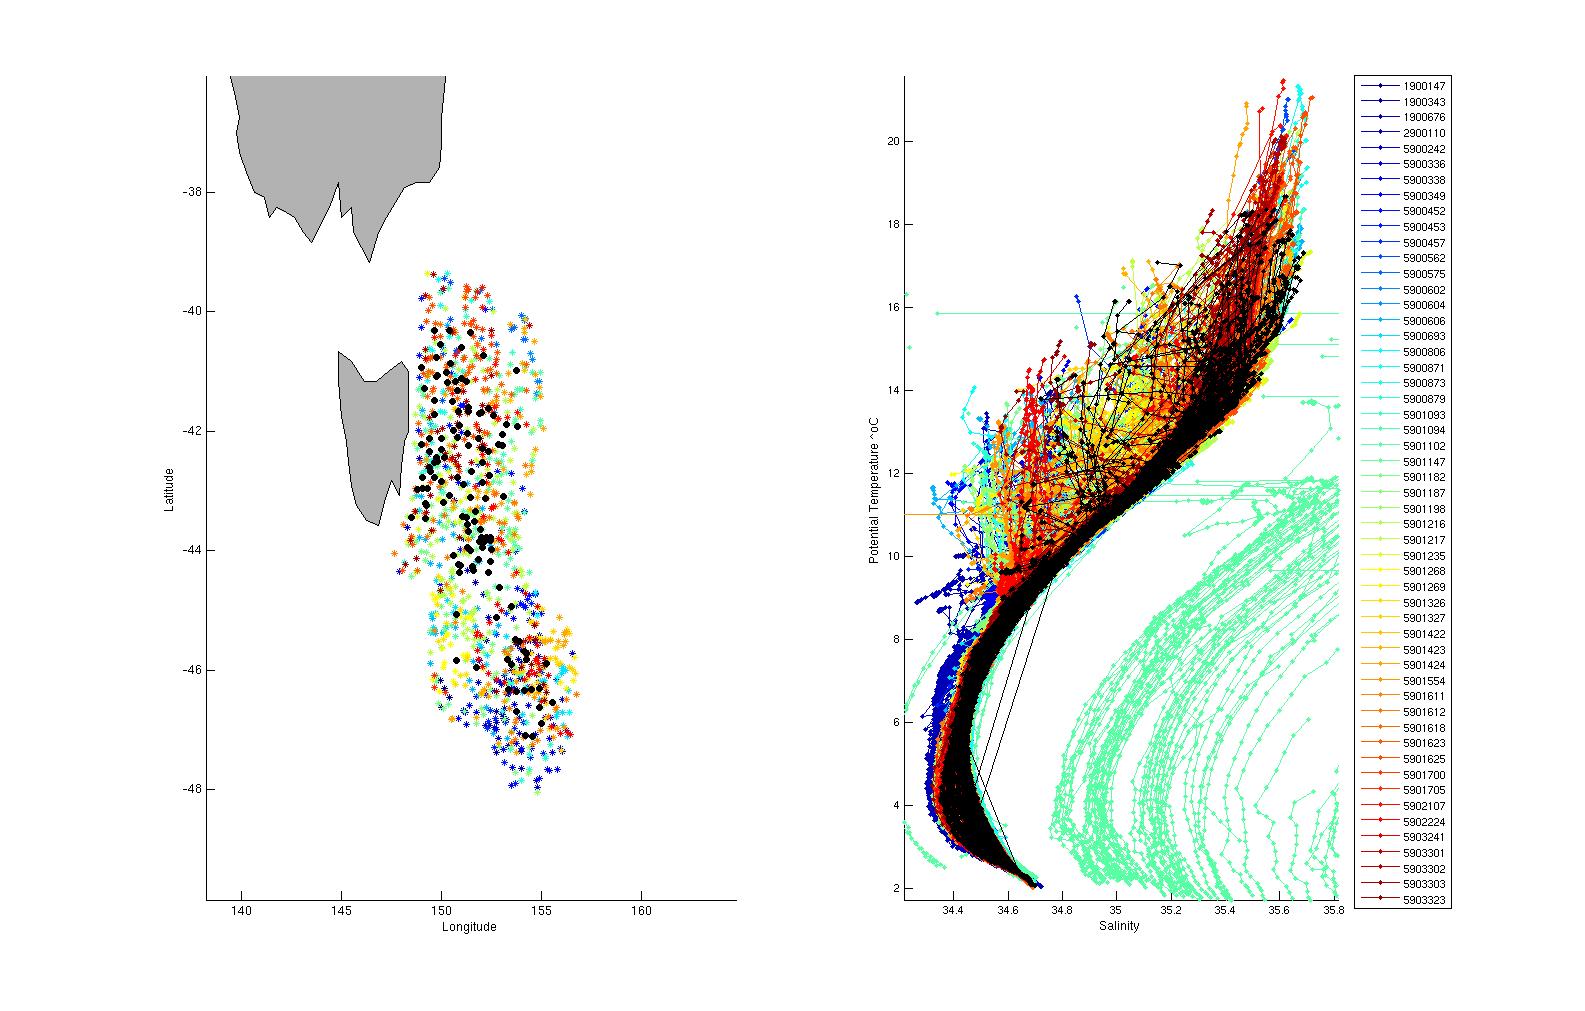
The potential-temperature/salinity relation for the deepest theta levels for this float (in black) and nearby argo floats (coloured) is displayed below.
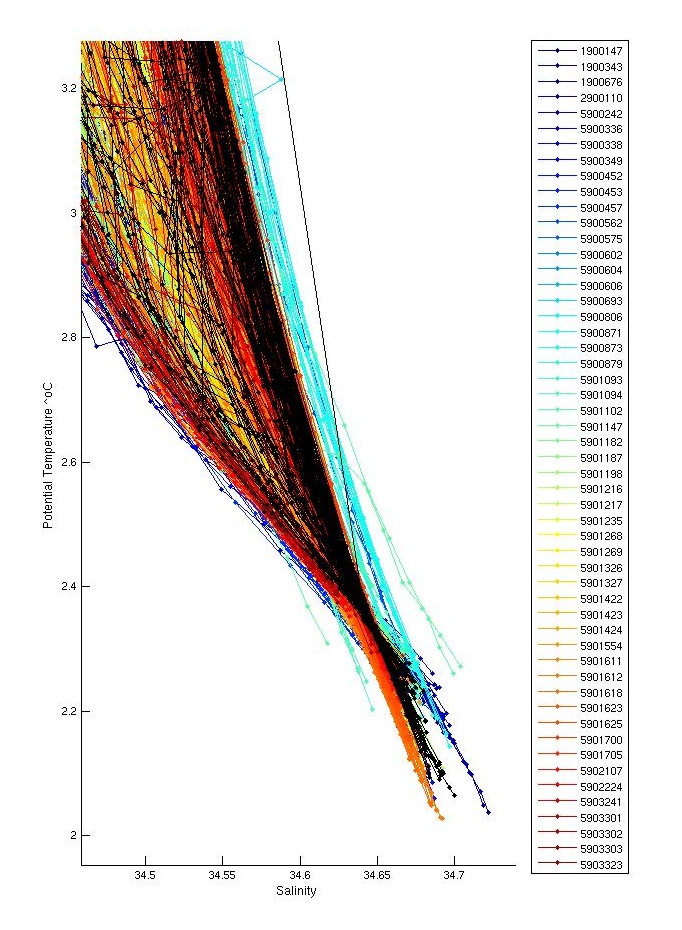
Comparison with neighbouring profiles shows a reasonable distribution of profiles with quite a bit of variability in mid to deep water. At depth, the profiles show quite a spread in variability but this is comparable to neighbouring profiles.
There were inversions in profiles; 30,34,37,52,95,105,110. These were not significant and were not flagged. Flagged the inversion in pf 83 at 285m as QC=4 for both T & S.
Salt hooks were located in profiles; 6,7,9,11,14,15,16,17,18,20,21,23,24,26,30,34,37,40,42,44,47,49,53,56,58,59,61,63,67,69,71,73,75,77,78,80,81,82,85,87,92,94,95,97,98,99,101,106,108. These were flagged as QC 4 for both T & S.
This float has lots of bad data in all 3 parameters and also missing data. Profiles 1, 4, 13, 19, 31, 36, 41 and 48 have missing blocks and profiles 31 and 35 have bad data in pressure. The real time software had flagged some bad values in profiles 29, 30, 34 and 37, these were inspected and looked fine so QC was changed back to 1. Removed the spike in profile 2 at 575 m depth. Profiles 52 and 54 have low temperatures at depth.
The plot below shows the analysis of salinity drift using the WJO/OW software.

This float requires no correction.
The four plots below show the salinity anomalies on theta surfaces compared to (a) the Gouretski and Kolterman climatology, (b) the CARS (CSIRO Atlas of Regional Seas)/WOA (World Ocean Atlas) climatology, (c) the anomalies within the float series itself, (i.e. the salinity anomaly of each profile from the mean profile average for the float and (d) the raw float salinity compared to the CARS and G&K climatological salinity on a deep theta surface.
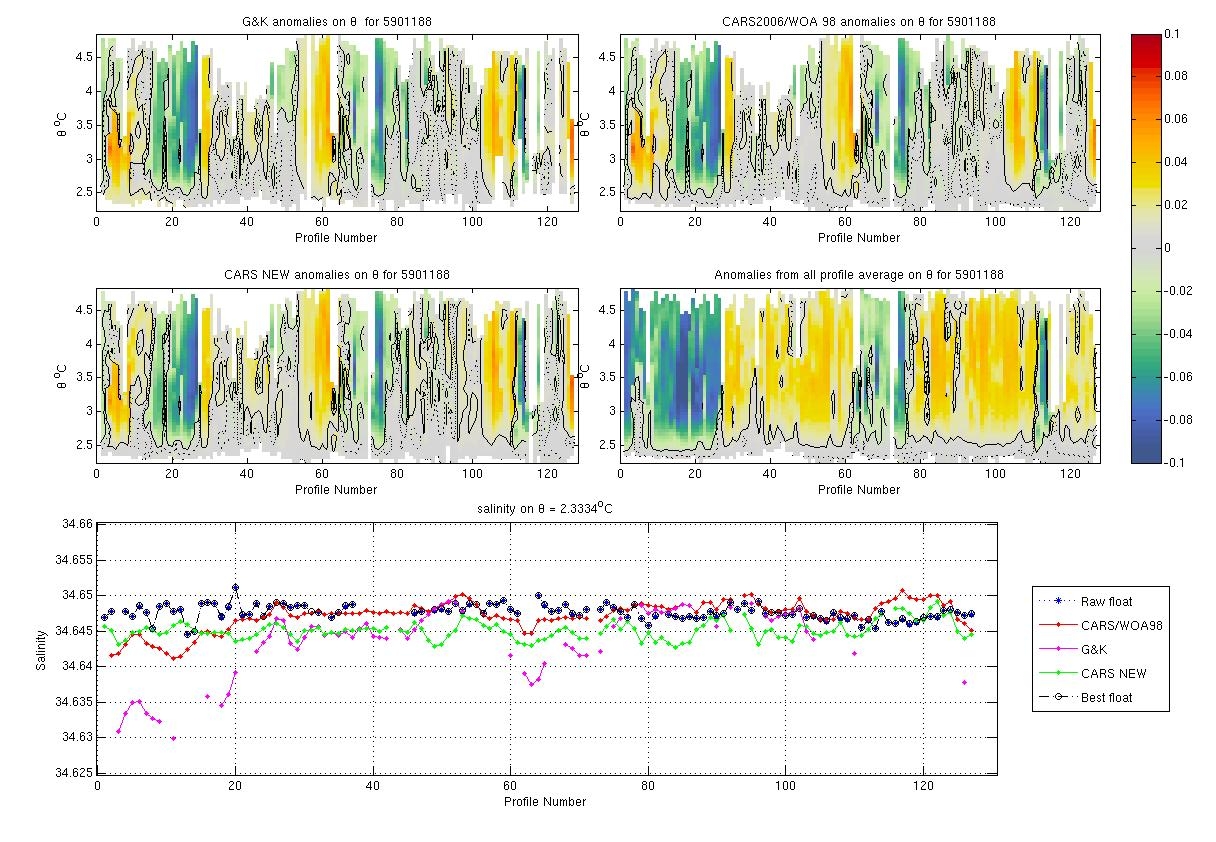
This float is very close to the climatologies.
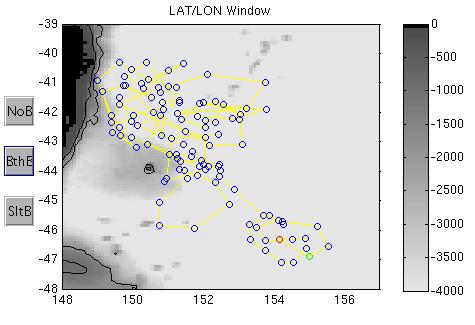
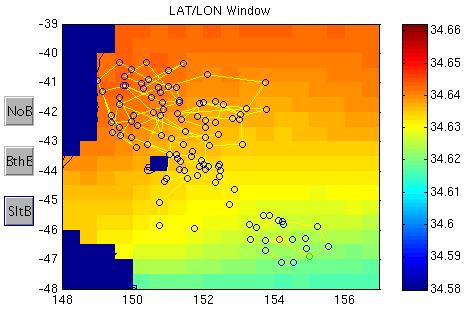
The plots below show the raw float salinity data (solid blue line) compared to neighbouring argo floats (coloured symbols) on a deep potential temperature surface. The locality map shows the location of the profiles for this float and for neighbouring floats.
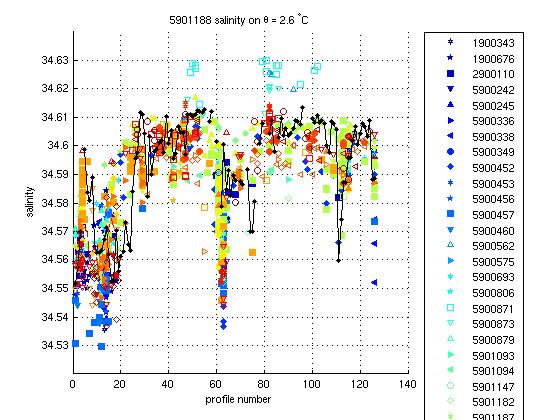
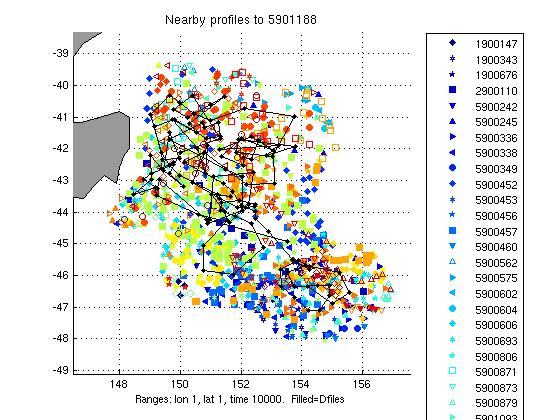
This float is in the middle to upper end of the nearby argo envelope.
This float required no salinity drift correction.
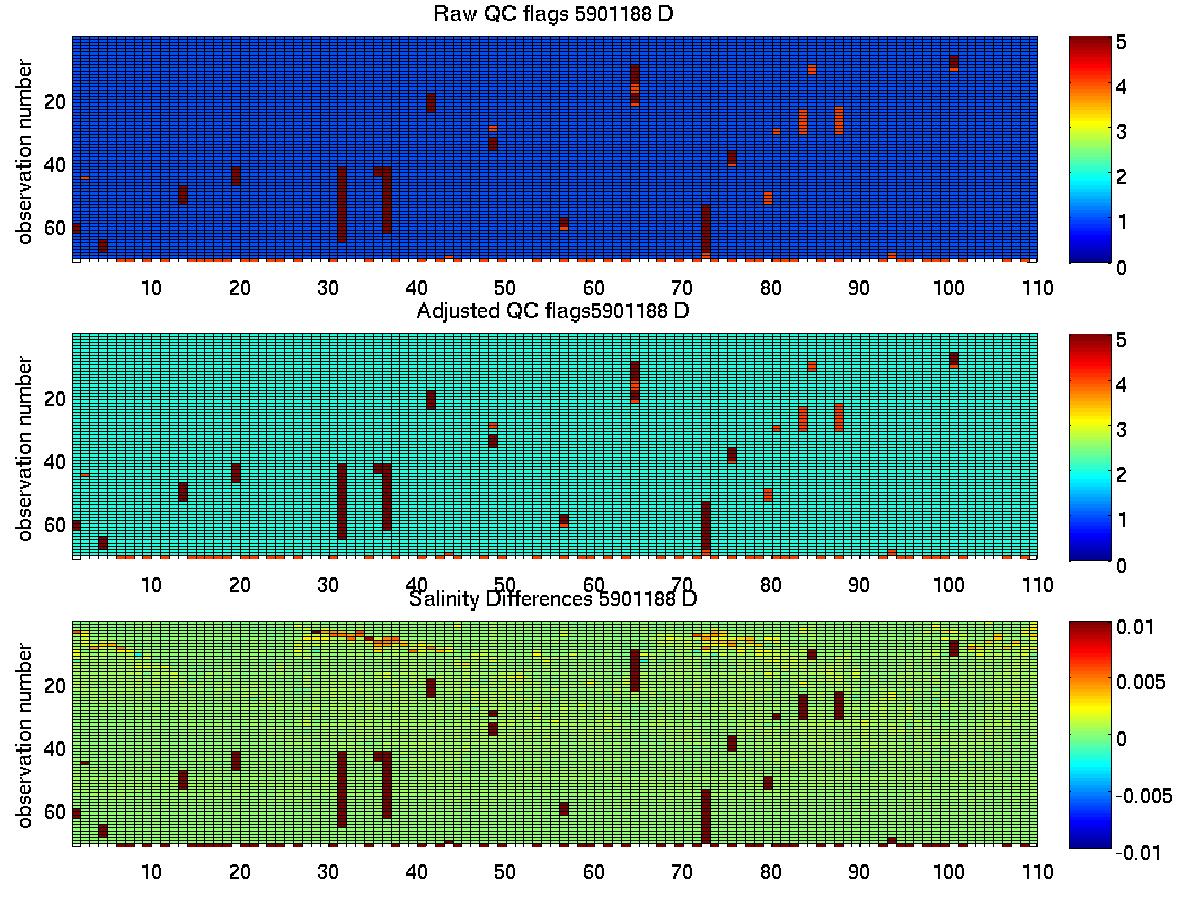
The plot below summarises the QC flags and salinity differences for the raw and adjusted salinity fields in the final delayed mode files submitted to the GDAC.
Created 13-08-2010