The table below provides basic information about the float, including primary sensors, mission parameters and current status of profiles.
| Institute | CSIRO |
| Principal Investigator | Susan Wijffels |
| Pressure Sensor | Druck (serial number=7929) |
| CTD Sensor | APEX-SBE-41 (serial number=2232) |
| CTD Sampling Mode | Burst Sampler |
| Controller Board | APF 8 |
| Additional Sensors/Software | None |
| Park Depth | 1000 m |
| Profile Depth | 2000 m |
| Launch Date | 21-12-2006 |
| Number of D-moded Profiles | 115 |
| Calibration Date | 16-08-2010 |
| Pressure Drift | Surface Pressure Offset corrected |
| Salinity Drift | No salinity drift detected |
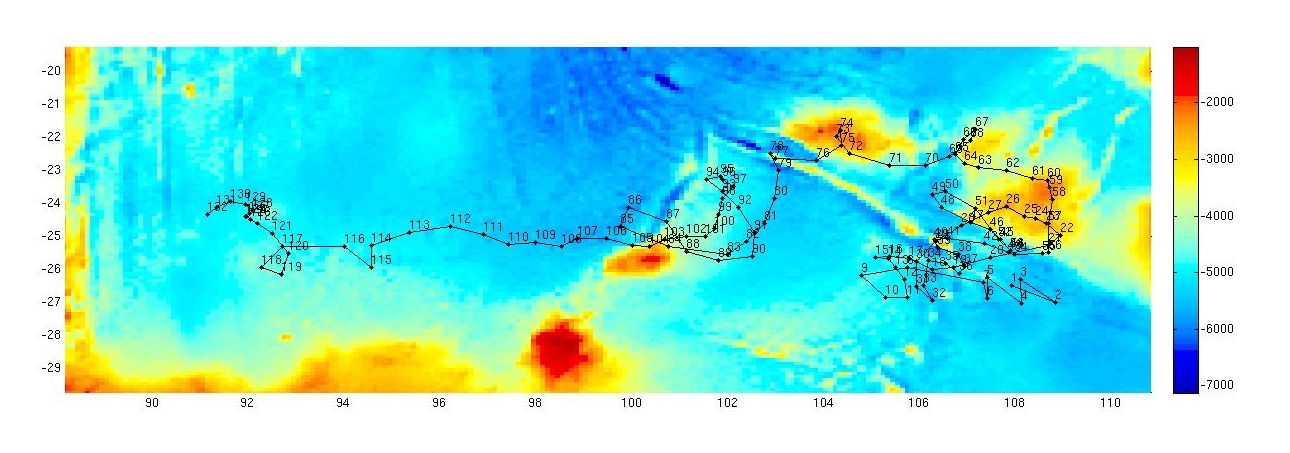
This float was deployed in the Southern Ocean to the south of Tasmania and New Zealand, in a region bounded by 103 to 109 şE and 21 to 27 şS.
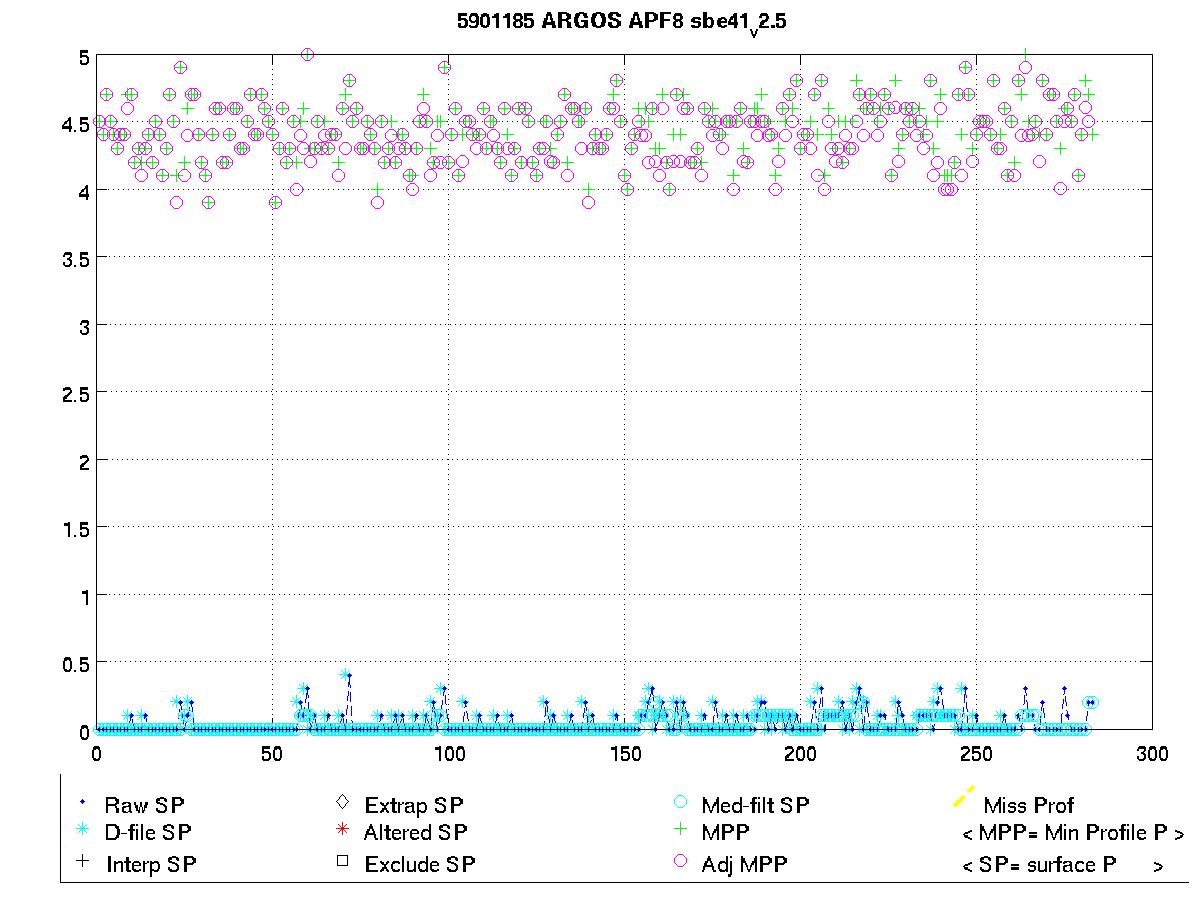
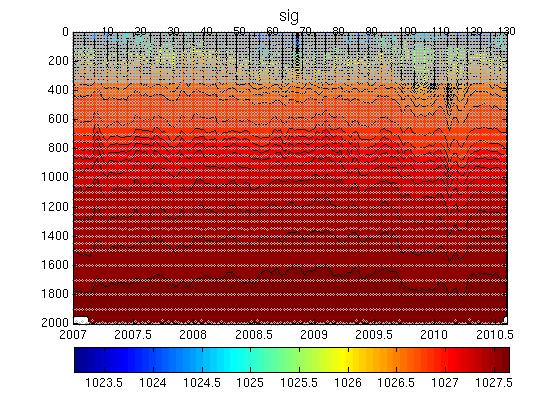
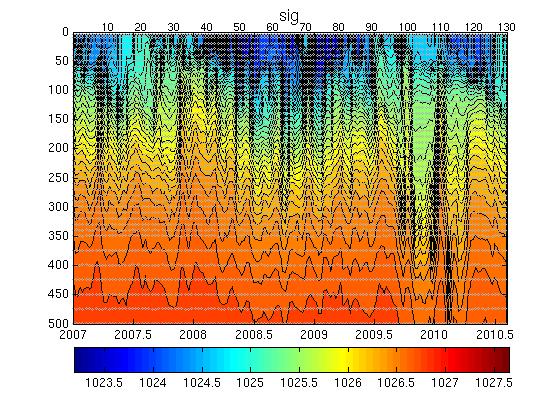
The surface pressure for this float is shown in the plot below.
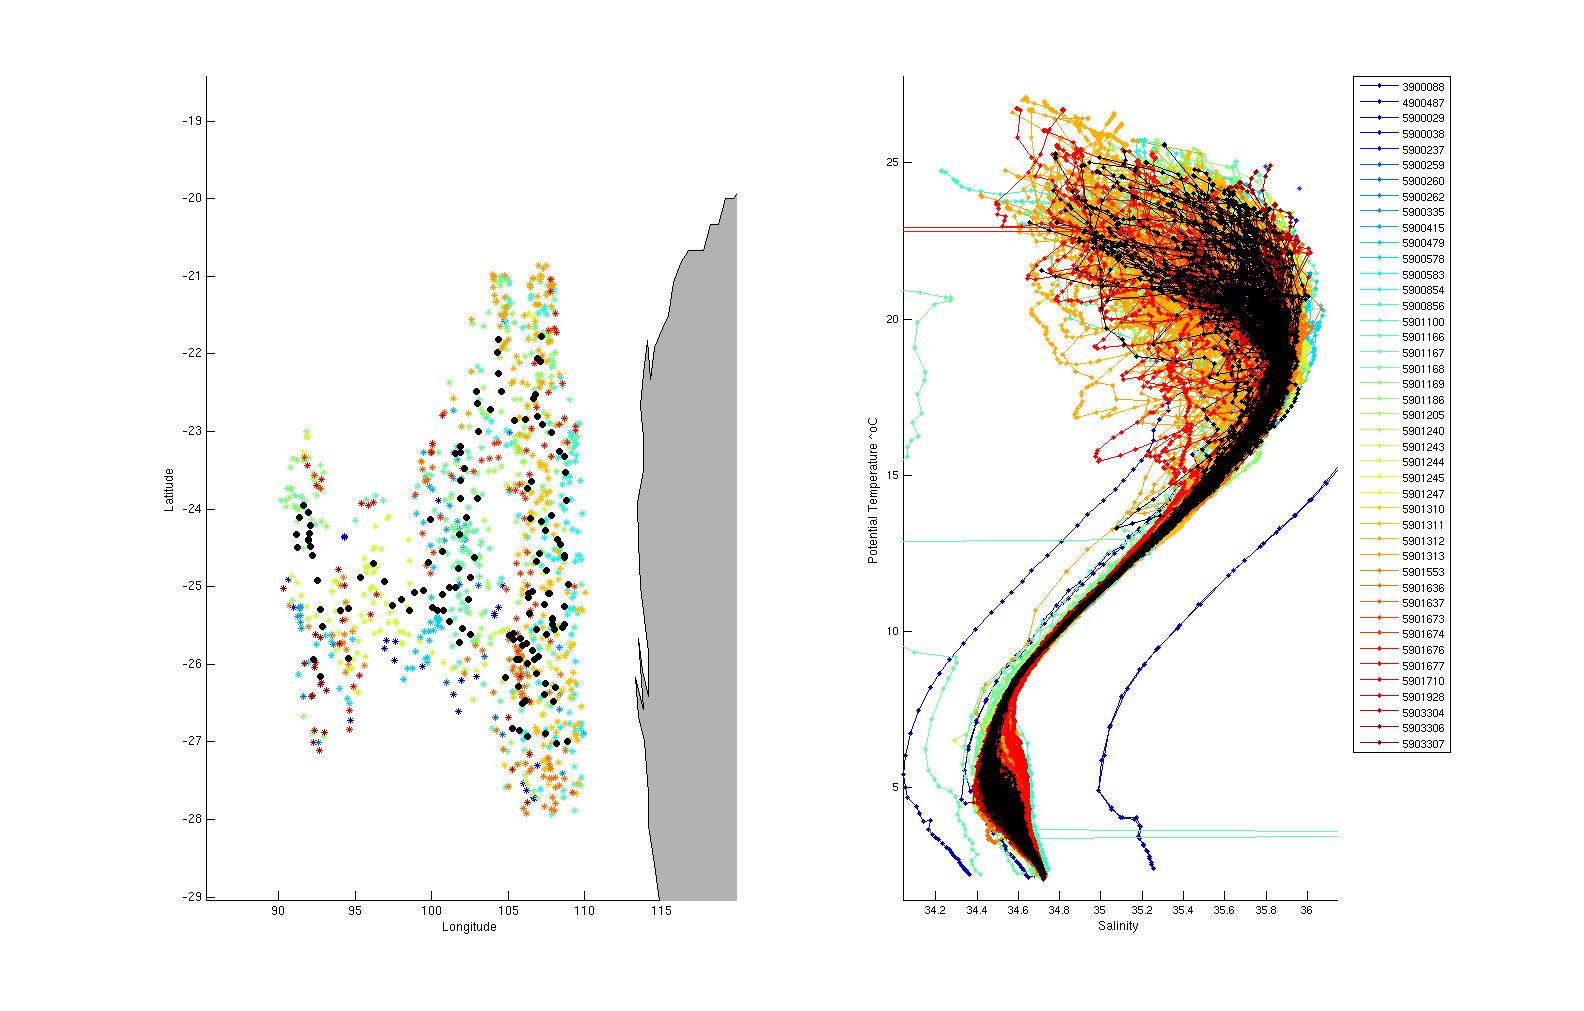
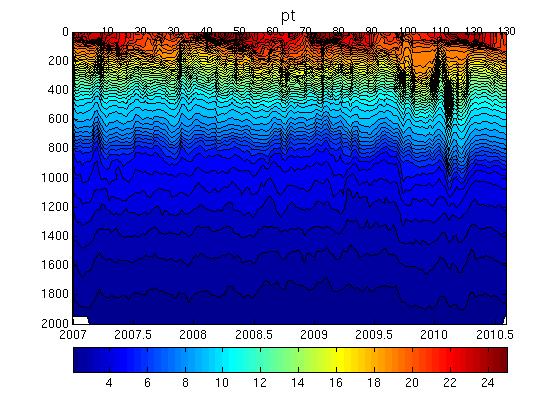
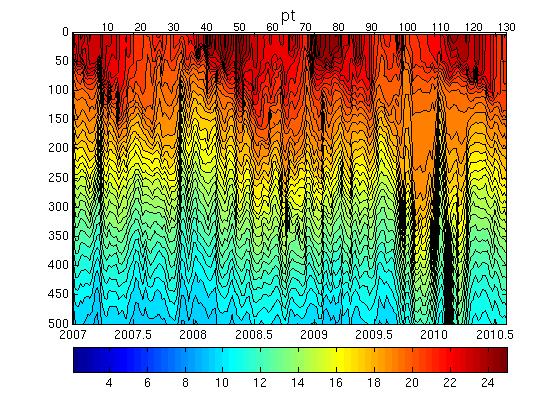
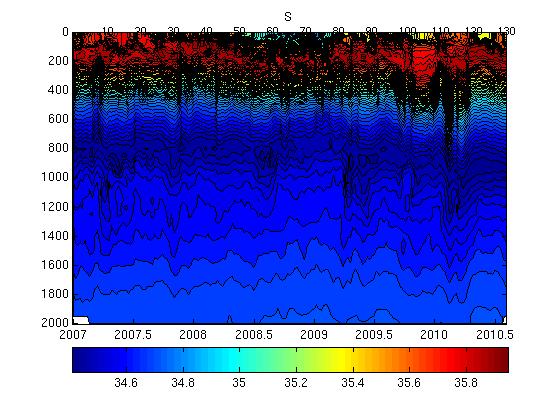
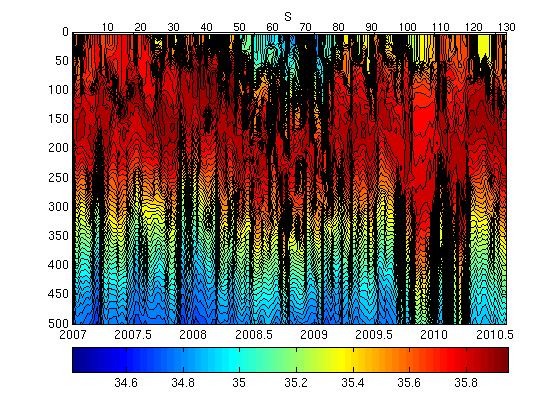
Potential Temperature-Salinity (a), Location (b, Max Temperature (c) and Sea Surface Salinity (d) plots located below.
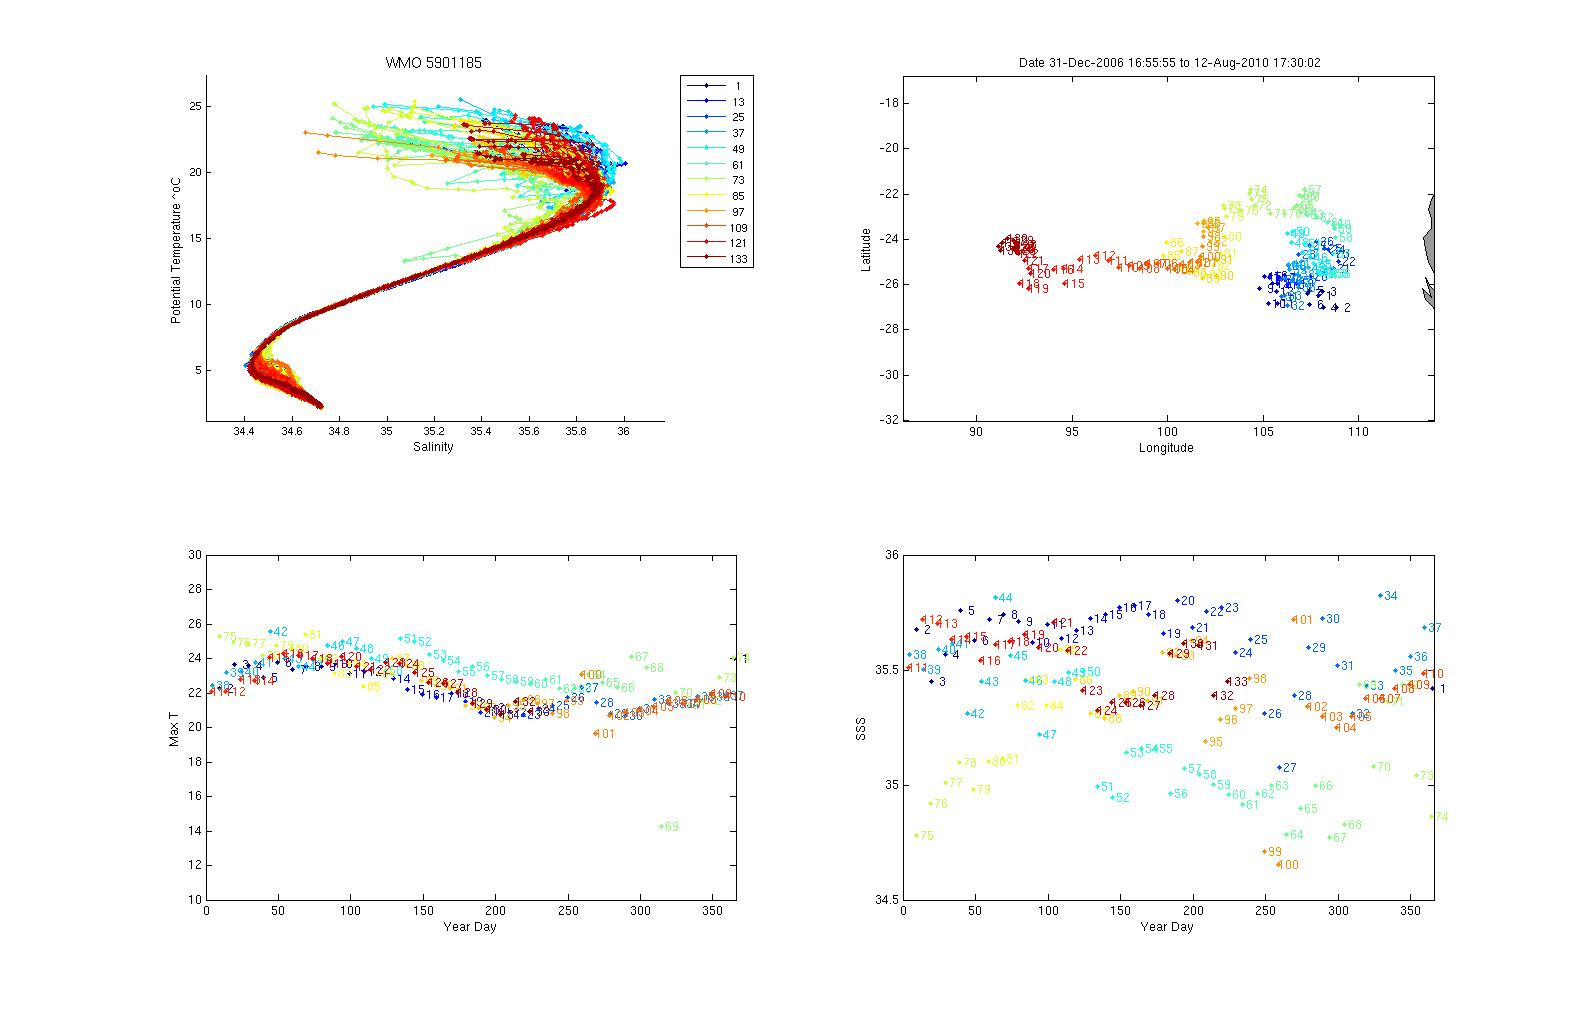
Surface temperatures generally varied between 21 and 26 şC and surface salinities from 34.7 to 35.8.
The plot below shows the potential-temperature/salinity relationship for the deepest theta levels where the relationship between the two parameters should show the least variation.
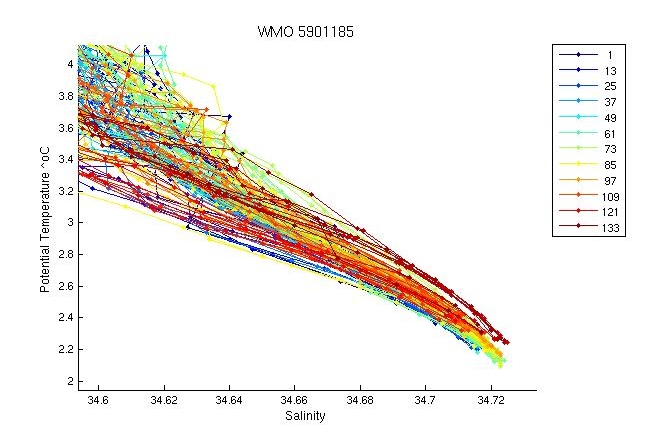
The profiles are tightly distributed through most of the water column with most variability occurring between potential temperatures of 3 and 6 degrees.
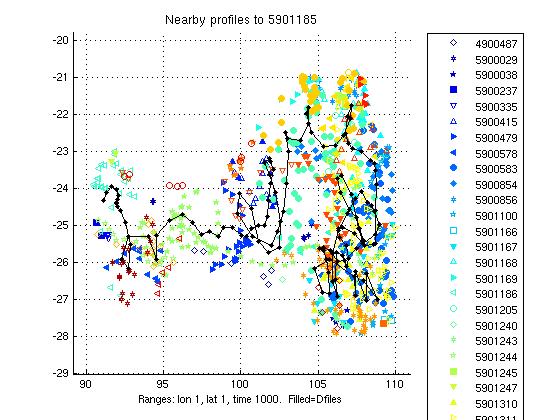
The two plots below show a). the location of this float (black circles) in relation to the position of other nearby argo floats (coloured circles) and b). The potential-temperature/salinity curve for this float (in black) compared to nearby argo floats (coloured).
The potential-temperature/salinity relation for the deepest theta levels for this float (in black) and nearby argo floats (coloured) is displayed below.
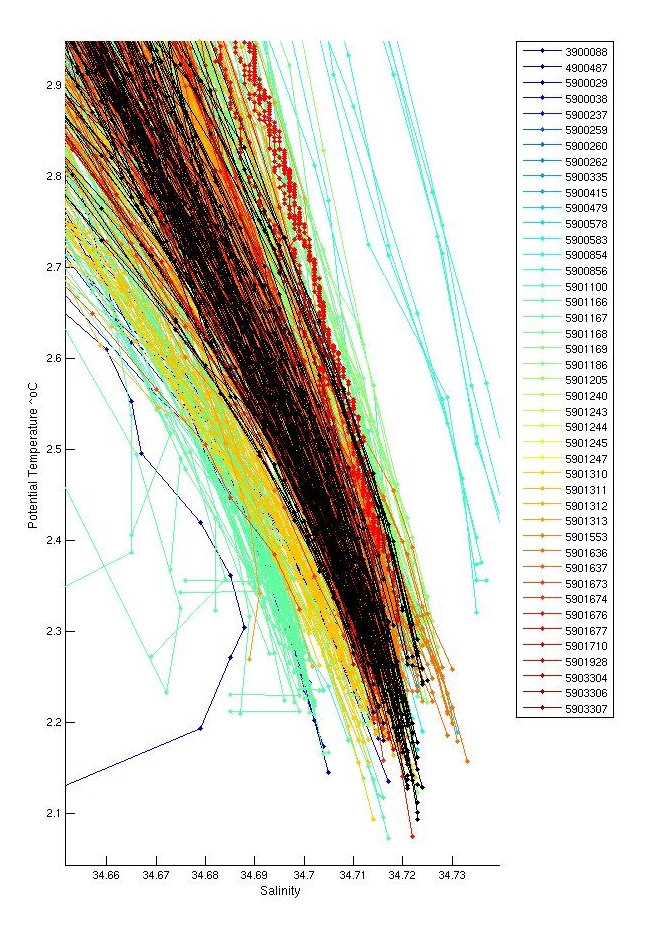
Comparison with neighbouring profiles shows that these profiles look fine. Neighbouring floats have similarly tight profile distributions with similar variability at depth. The deep profiles are right in the middle of the group.
There were inversions in profiles; 1,47. These were not significant and were not flagged.
Salt hooks were located in profiles; 3,5,9,11,13,15,17,19,21,23,26,27,31,34,35,37,39,41,44,45,48,50,53,59,61,63,65,67,71,72,76,77,79,81,83,85,86,88,91,93,95,97,99,102,103,105,107,109,113. These were flagged as QC 4 for both T & S.
There were no missing profiles. A spike in profile 52 was flagged as QC=4 for both T & S.
The plot below shows the analysis of salinity drift using the WJO/OW software.

This float requires no correction.
The four plots below show the salinity anomalies on theta surfaces compared to (a) the Gouretski and Kolterman climatology, (b) the CARS (CSIRO Atlas of Regional Seas)/WOA (World Ocean Atlas) climatology, (c) the anomalies within the float series itself, (i.e. the salinity anomaly of each profile from the mean profile average for the float and (d) the raw float salinity compared to the CARS and G&K climatological salinity on a deep theta surface.
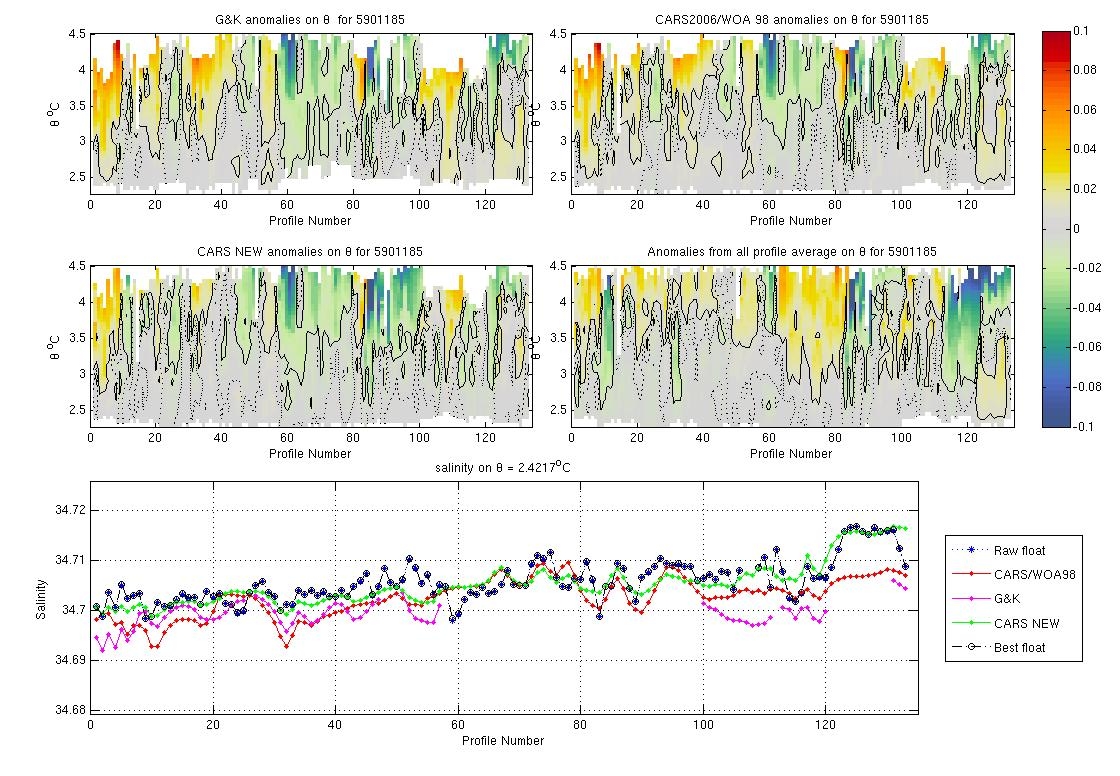
This float is very close to climatologies.
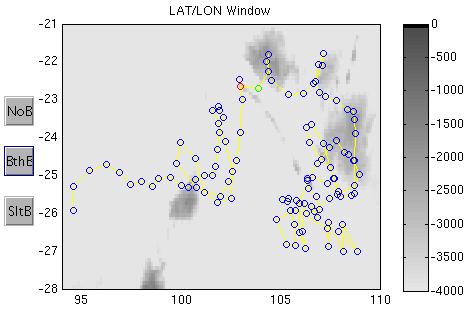
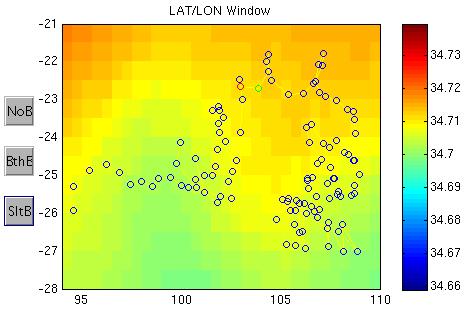
The plots below show the raw float salinity data (solid blue line) compared to neighbouring argo floats (coloured symbols) on a deep potential temperature surface. The locality map shows the location of the profiles for this float and for neighbouring floats.
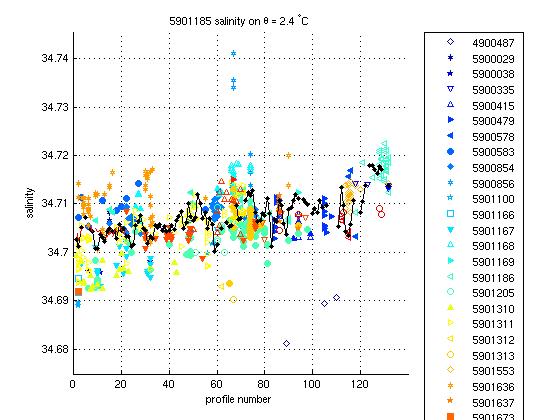
This float looks fine as it is right in the middle of the nearby argo envelope.
This float required no salinity drift correction.
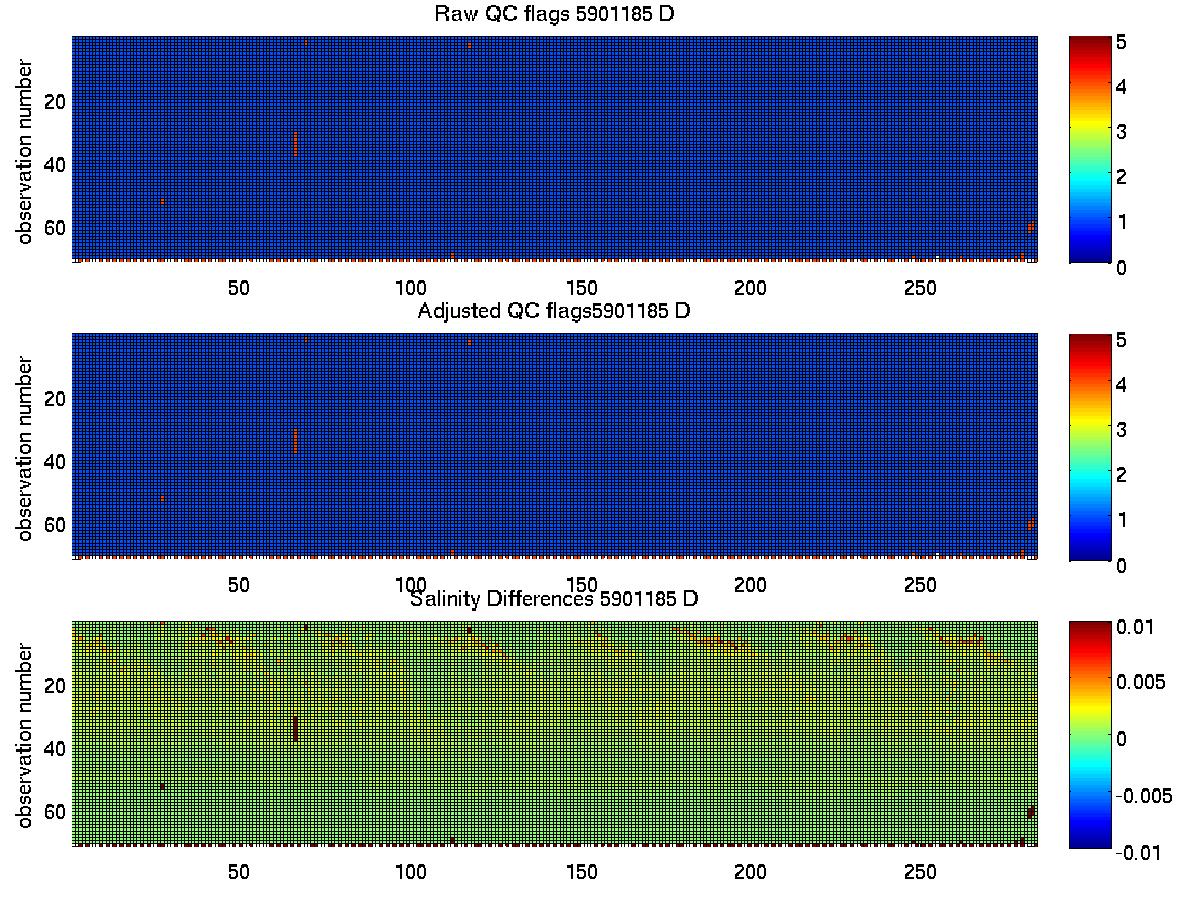
The plot below summarises the QC flags and salinity differences for the raw and adjusted salinity fields in the final delayed mode files submitted to the GDAC.
Created 16-08-2010