The table below provides basic information about the float, including primary sensors, mission parameters and current status of profiles.
| Institute | CSIRO |
| Principal Investigator | Susan Wijffels |
| Pressure Sensor | Druck (serial number=10279) |
| CTD Sensor | APEX-SBE-41 (serial number=2907) |
| CTD Sampling Mode | Burst Sampler |
| Controller Board | APF 8 |
| Additional Sensors/Software | None |
| Park Depth | 1000 m |
| Profile Depth | 2000 m |
| Launch Date | 28-11-2006 |
| Number of D-moded Profiles | 155 |
| Calibration Date | 18-08-2011 |
| Pressure Drift | Surface Pressure Offset corrected |
| Salinity Drift | No salinity drift detected |
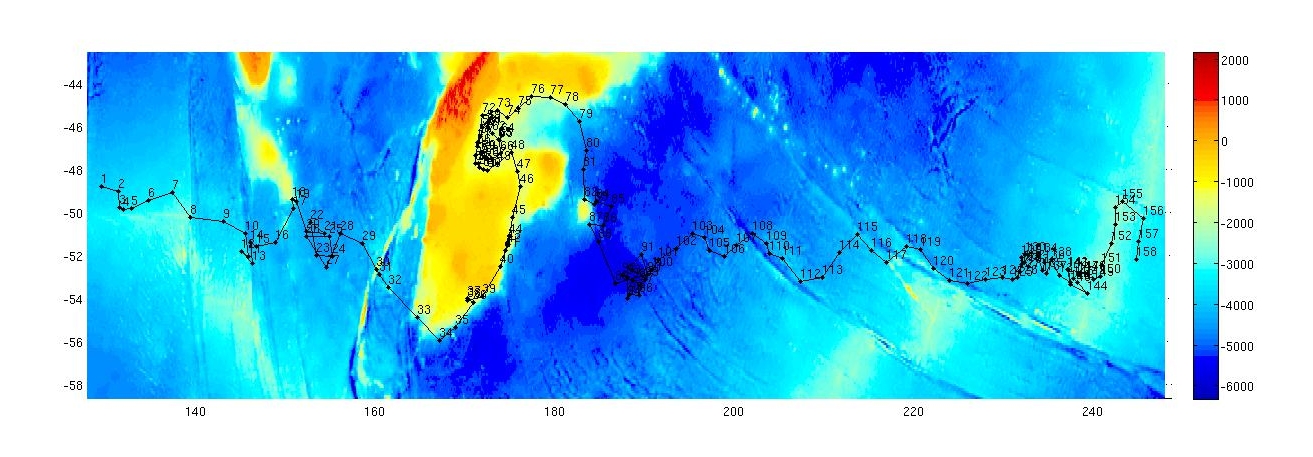
This float was deployed in the Southern Ocean to the south of Australia, in a region bounded by 130 şE to 110 şW and 44 to 60 şS.
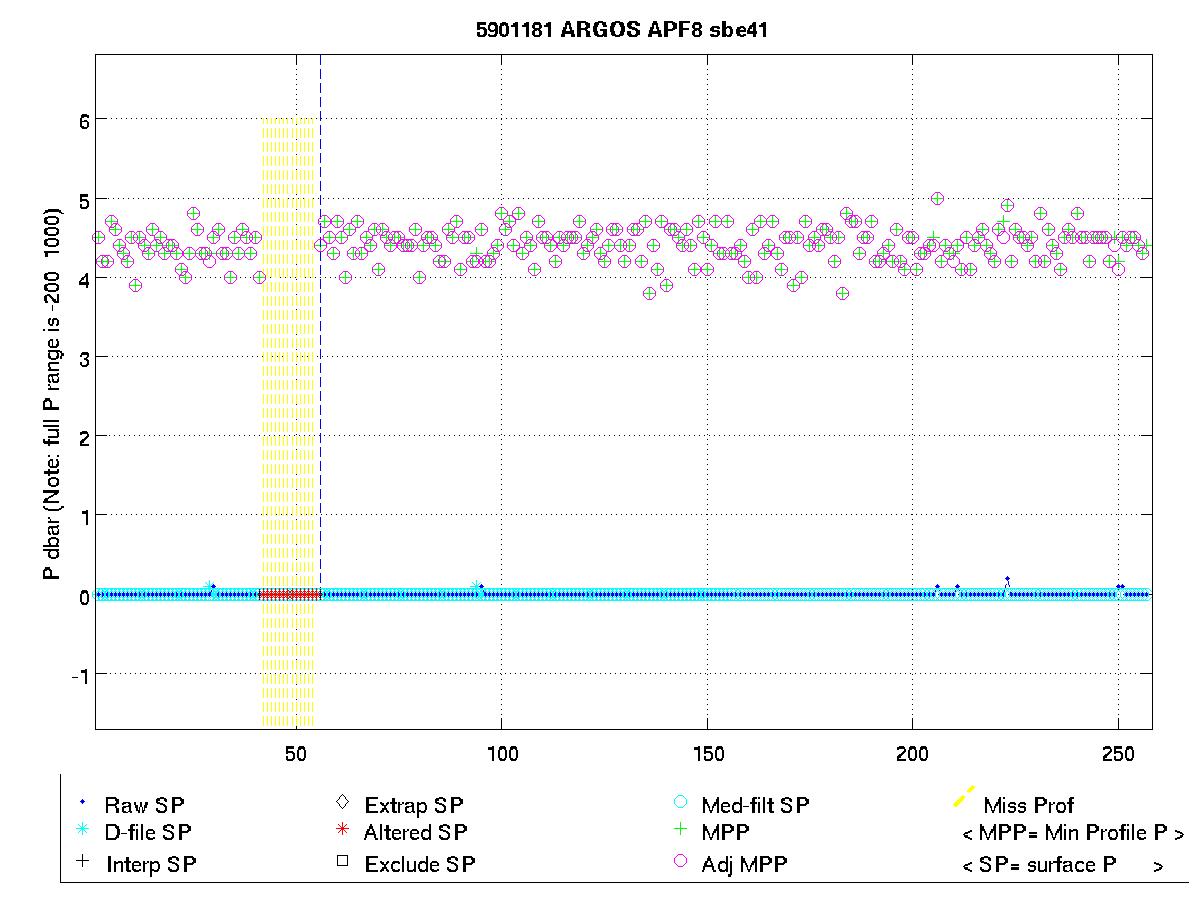
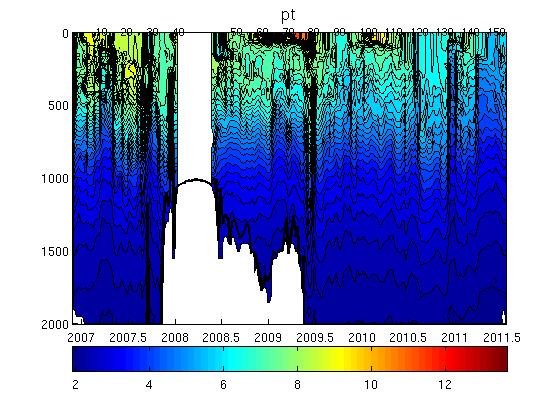
The surface pressure for this float is shown in the plot below.
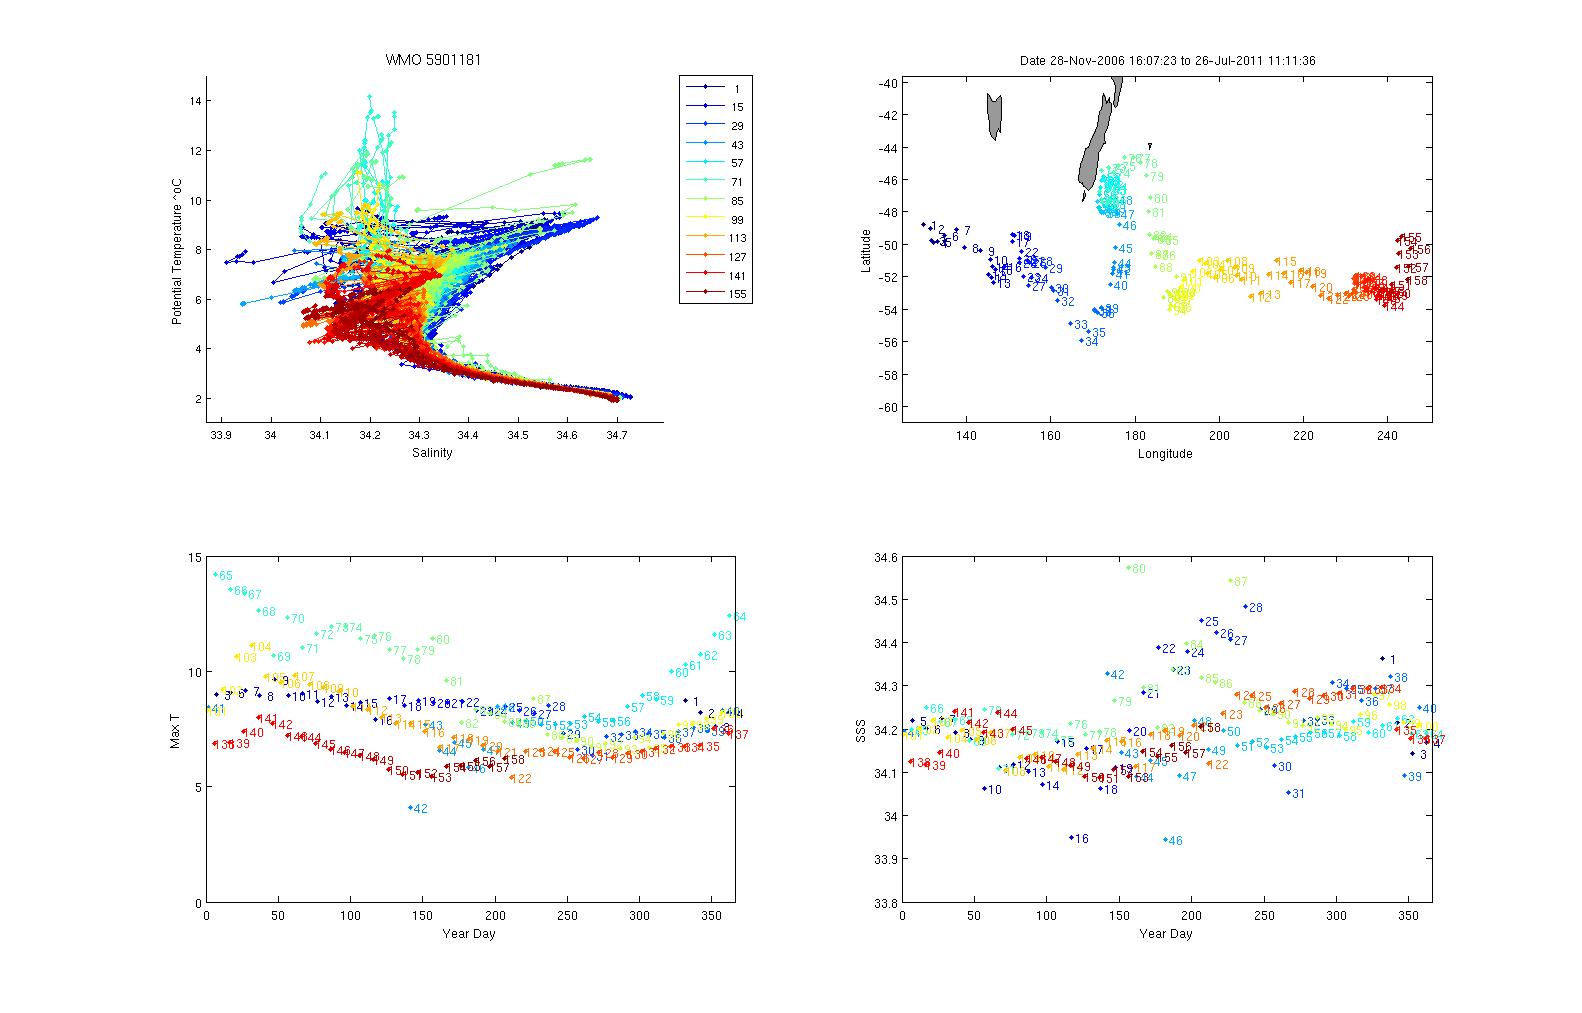
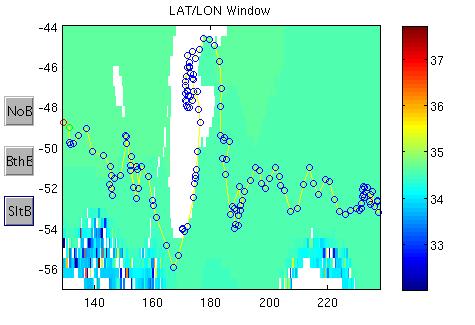
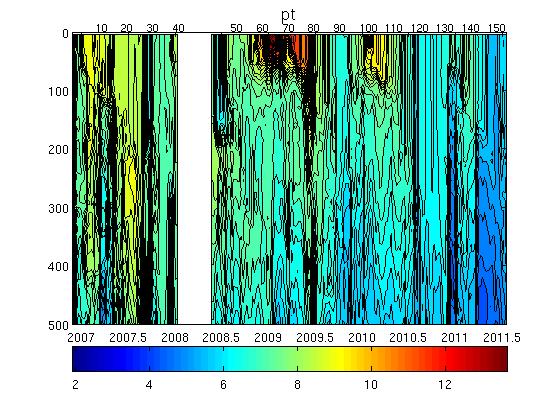
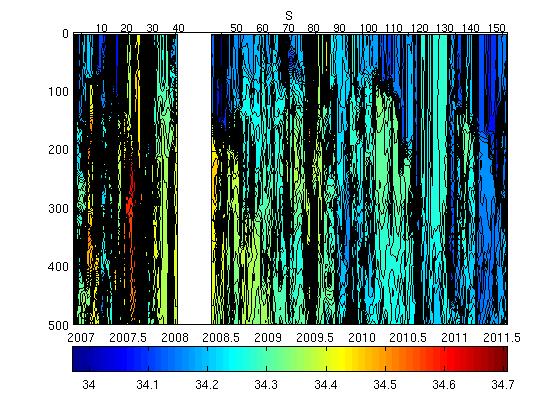
Potential Temperature-Salinity (a), Location (b, Max Temperature (c) and Sea Surface Salinity (d) plots located below.
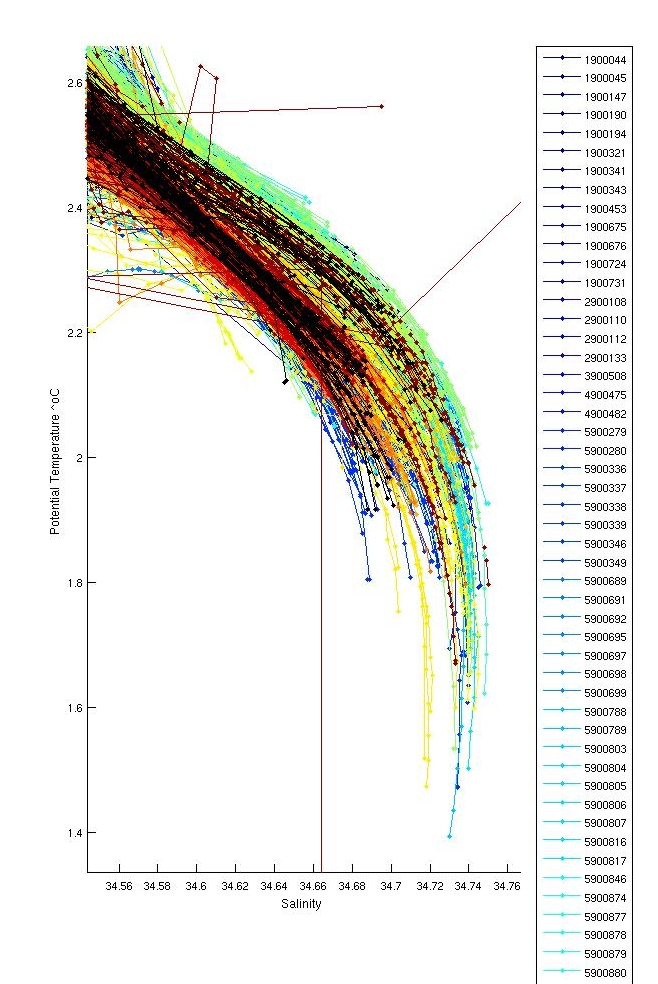
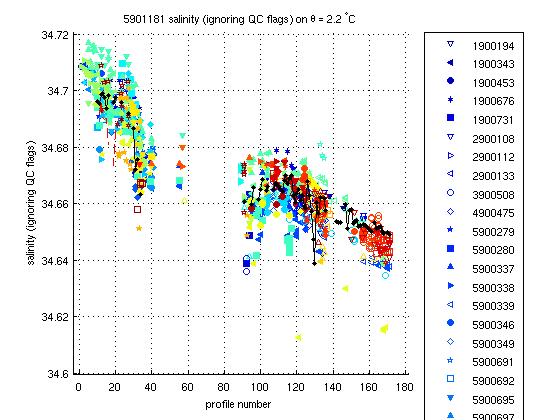
The plot below shows the potential-temperature/salinity relationship for the deepest theta levels where the relationship between the two parameters should show the least variation.
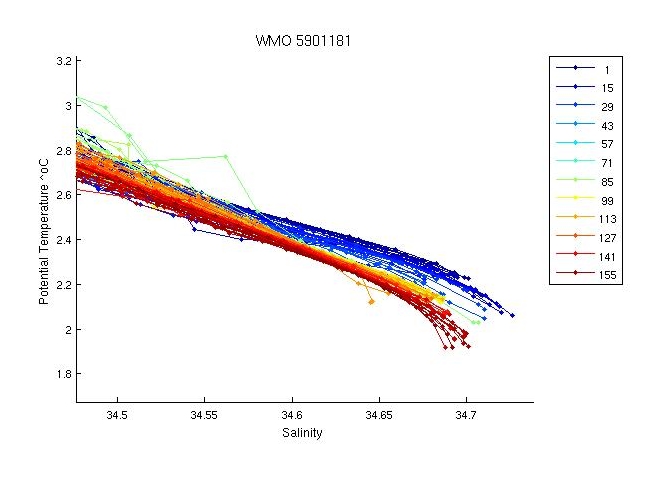
There is a large spread in the deep profiles with earlier profiles saltier than later profiles. The float has covered a considerable distance so this is probably real. One profile in paricular hangs particularly fresh at depth.
The two plots below show a). the location of this float (black circles) in relation to the position of other nearby argo floats (coloured circles) and b). The potential-temperature/salinity curve for this float (in black) compared to nearby argo floats (coloured).
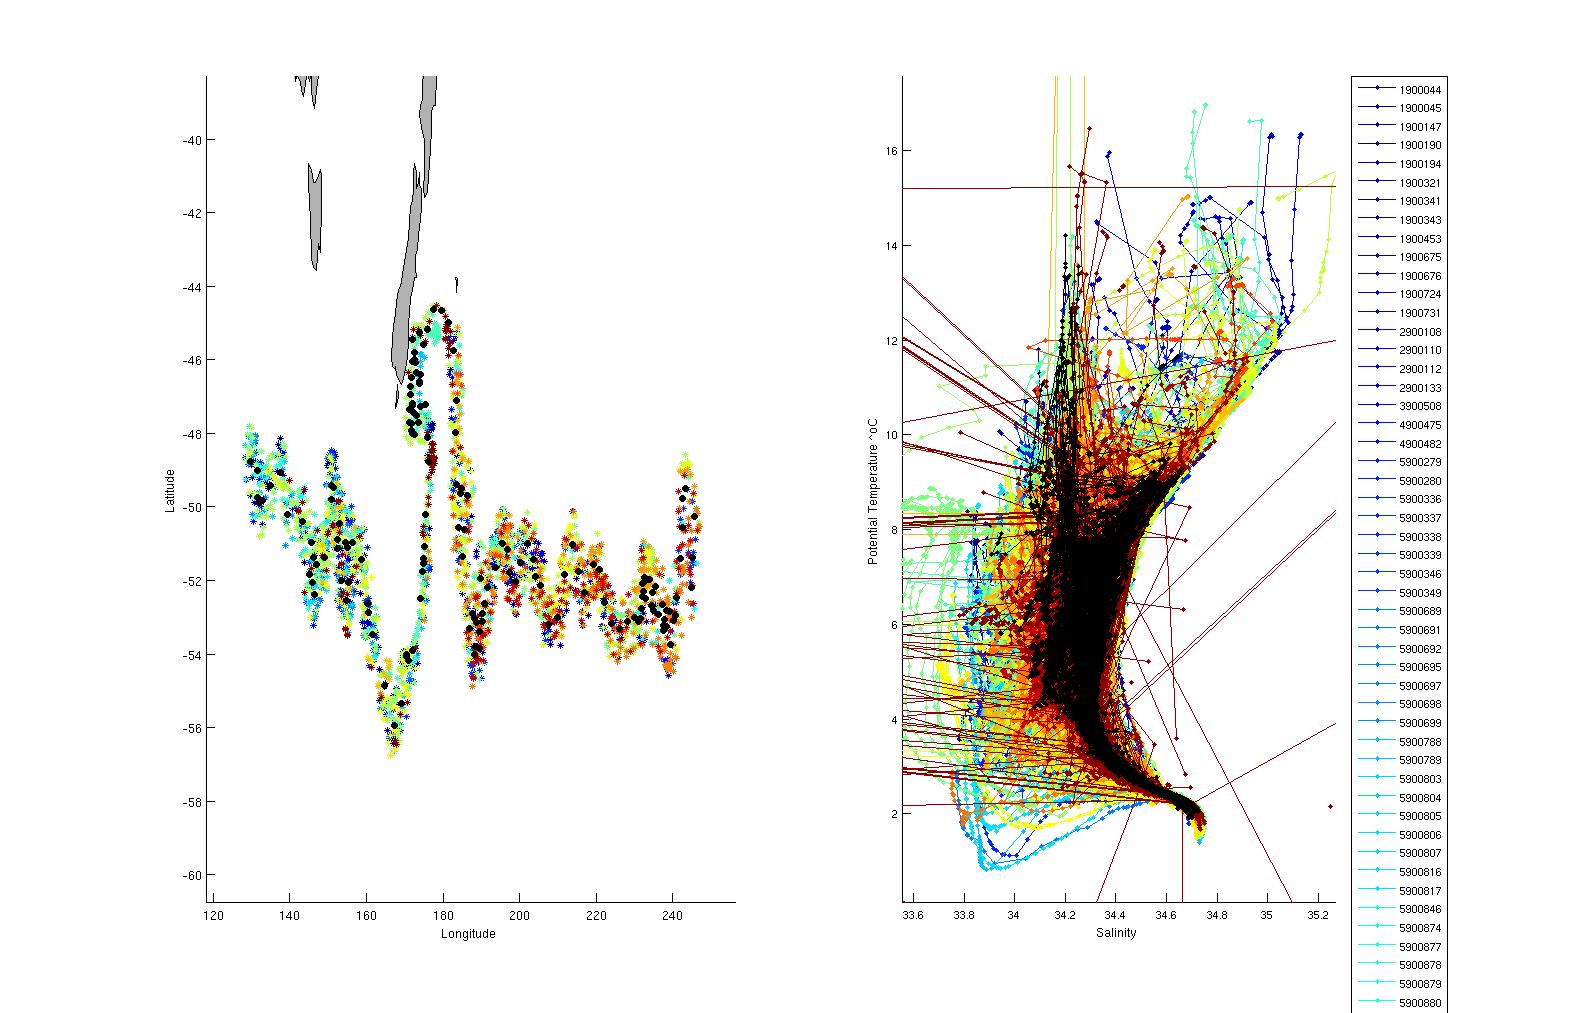
The potential-temperature/salinity relation for the deepest theta levels for this float (in black) and nearby argo floats (coloured) is displayed below.
There were inversions in profiles; 12,18,99,100,114,137,145,153. These were not significant and were not flagged. Inversions in profiles; 16,34, were flagged as QC=4.
Salt hooks were located in profiles; 5,7,8,11,13,15,17,18,20,21,23,25,27,28,32,33,35,92,93,94,95,96,97,98,99,100,101,102,103,104,110,112,114,116,118,120,122,124,126,129,131,134,136,137,139,141,143,145,147,150,151,153. These were flagged as QC 4 for both T & S.
The float grounded on multiple profiles and there were numerous missing profiles (42 to 54). The real time software flagged multiple values in pf 40 as QC=4. Flagged spike in pf 41 (at 550 m and 950 m depth as QC=4). Flagged the bottom of mulitple profiles where the float grounded. All of profile 42 was flagged as QC=4 for both T & S - there were only two values in the whole profile, both bad.
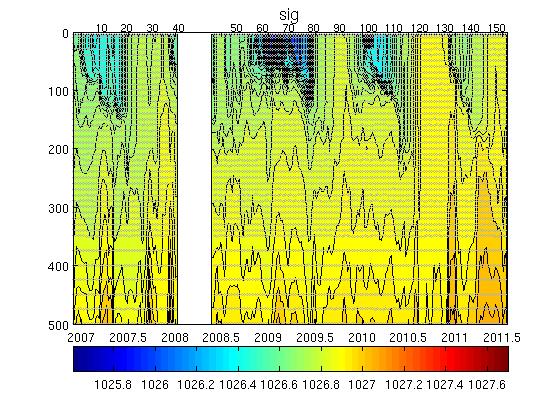
The plot below shows the analysis of salinity drift using the WJO/OW software.

This float requires no correction.
The four plots below show the salinity anomalies on theta surfaces compared to (a) the Gouretski and Kolterman climatology, (b) the CARS (CSIRO Atlas of Regional Seas)/WOA (World Ocean Atlas) climatology, (c) the anomalies within the float series itself, (i.e. the salinity anomaly of each profile from the mean profile average for the float and (d) the raw float salinity compared to the CARS and G&K climatological salinity on a deep theta surface.
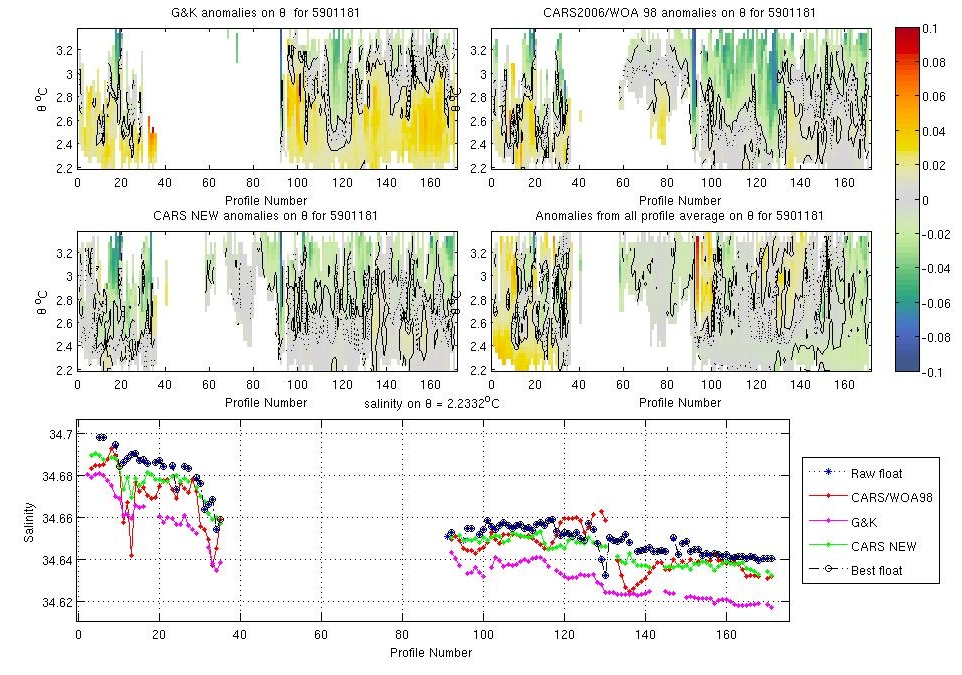
This float is close to climatologies.
The plots below show the raw float salinity data (solid blue line) compared to neighbouring argo floats (coloured symbols) on a deep potential temperature surface. The locality map shows the location of the profiles for this float and for neighbouring floats.
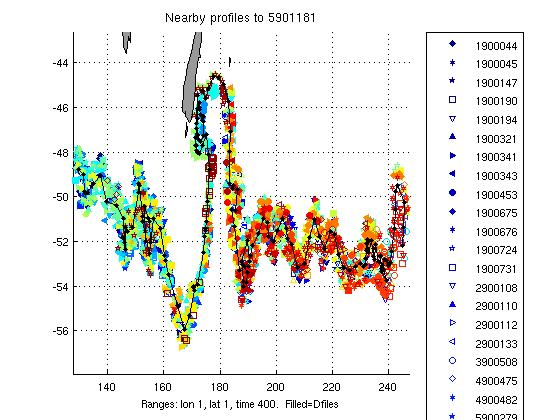
This float is in the middle of the nearby envelope.
This float required no salinity drift correction.
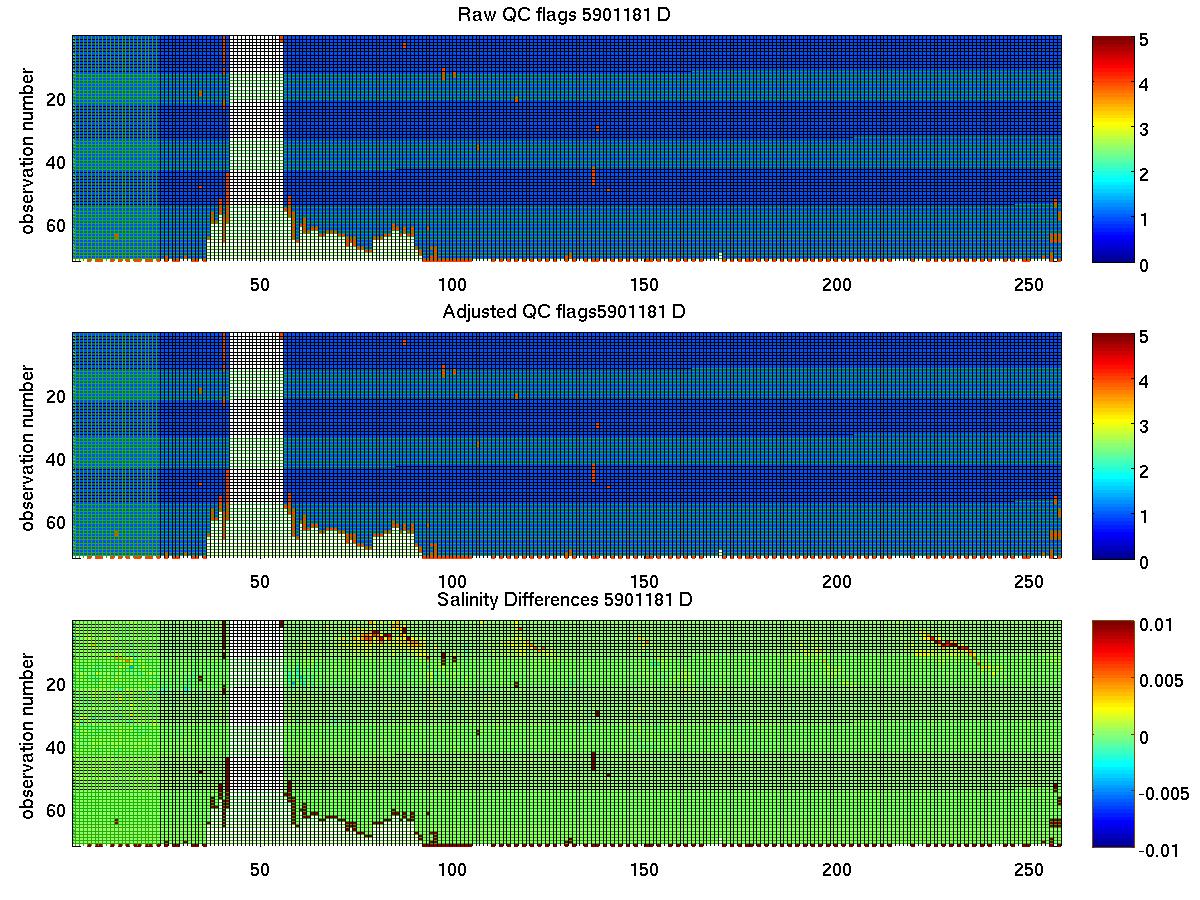
The plot below summarises the QC flags and salinity differences for the raw and adjusted salinity fields in the final delayed mode files submitted to the GDAC.