The table below provides basic information about the float, including primary sensors, mission parameters and current status of profiles.
| Institute | CSIRO |
| Principal Investigator | Susan Wijffels |
| Pressure Sensor | Druck (serial number=10270) |
| CTD Sensor | APEX-SBE-41 (serial number=3010) |
| CTD Sampling Mode | Burst Sampler |
| Controller Board | APF 8 |
| Additional Sensors/Software | Ice detection software |
| Park Depth | 1000 m |
| Profile Depth | 2000 m |
| Launch Date | 28-11-2006 |
| Number of D-moded Profiles | 63 |
| Calibration Date | 01-03-2009 |
| Pressure Drift | No drift in Surface Pressure Offset detected |
| Salinity Drift | No salinity drift detected |
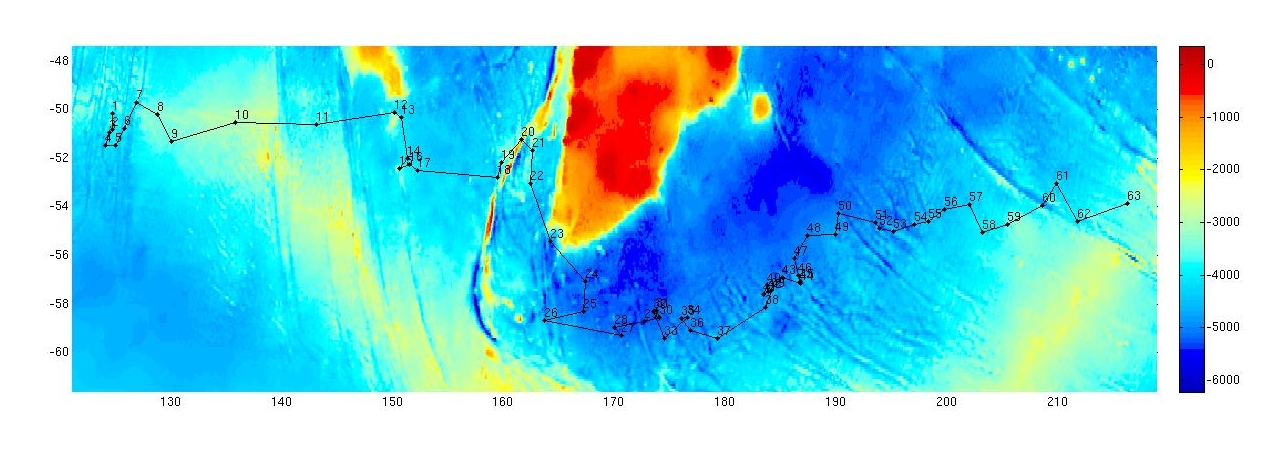
This float was deployed in the Southern Ocean to the south of Australia, in a region bounded by 122 to 220 şE and 49 to 60 şS. The float was deployed south of the GAB and has drifted to the south of Tasmania, past New Zealand and into the Pacific Ocean straight east.
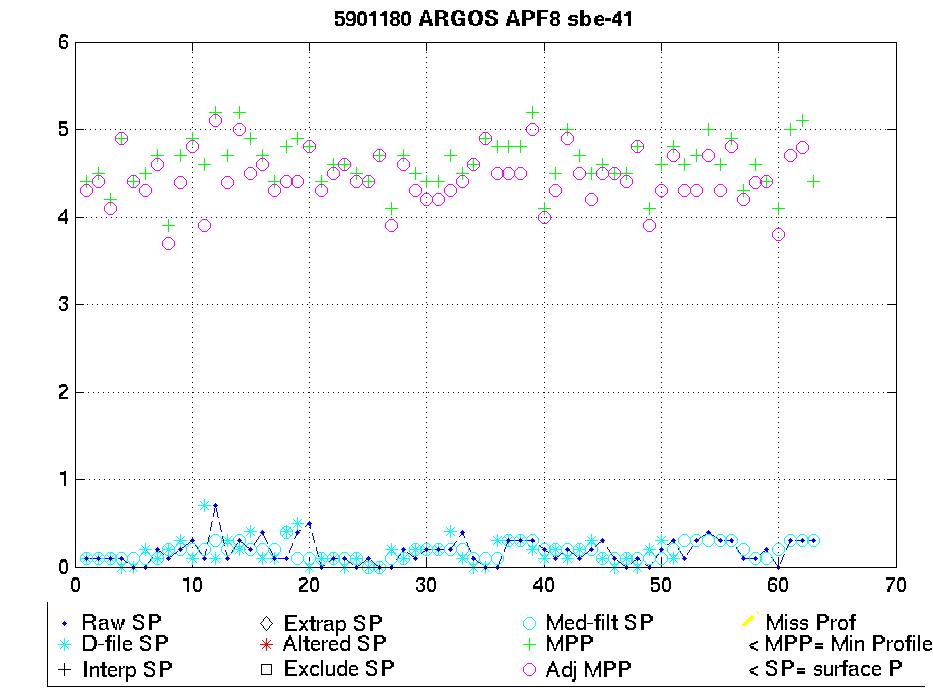
The surface pressure for this float is shown in the plot below.
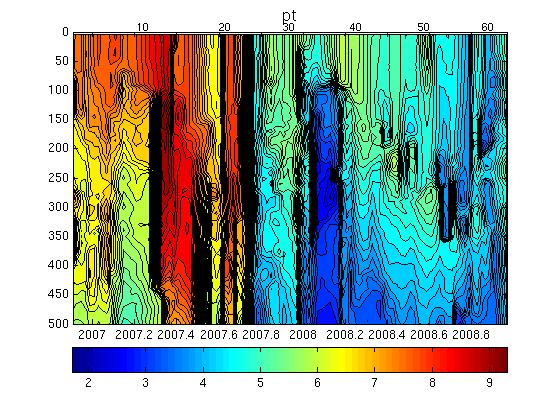
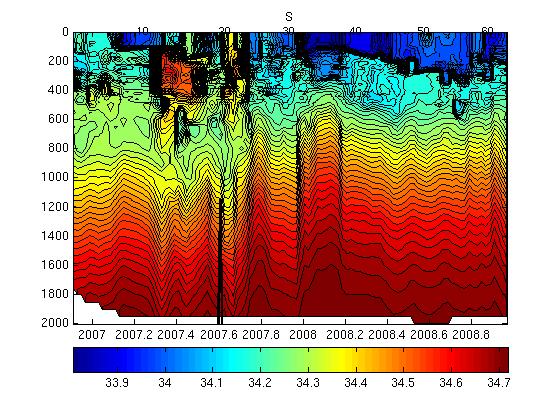
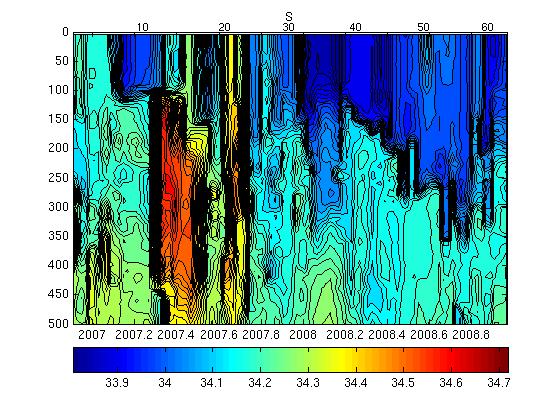
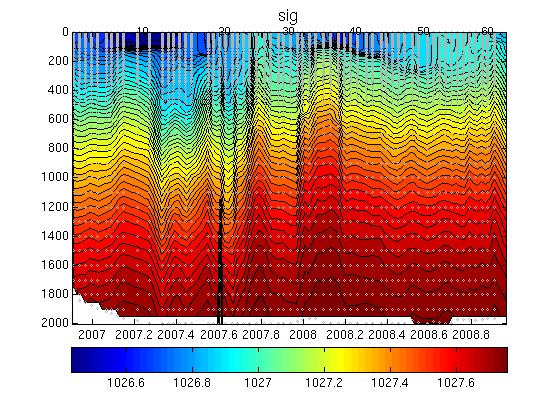
Potential Temperature-Salinity (a), Location (b, Max Temperature (c) and Sea Surface Salinity (d) plots located below.
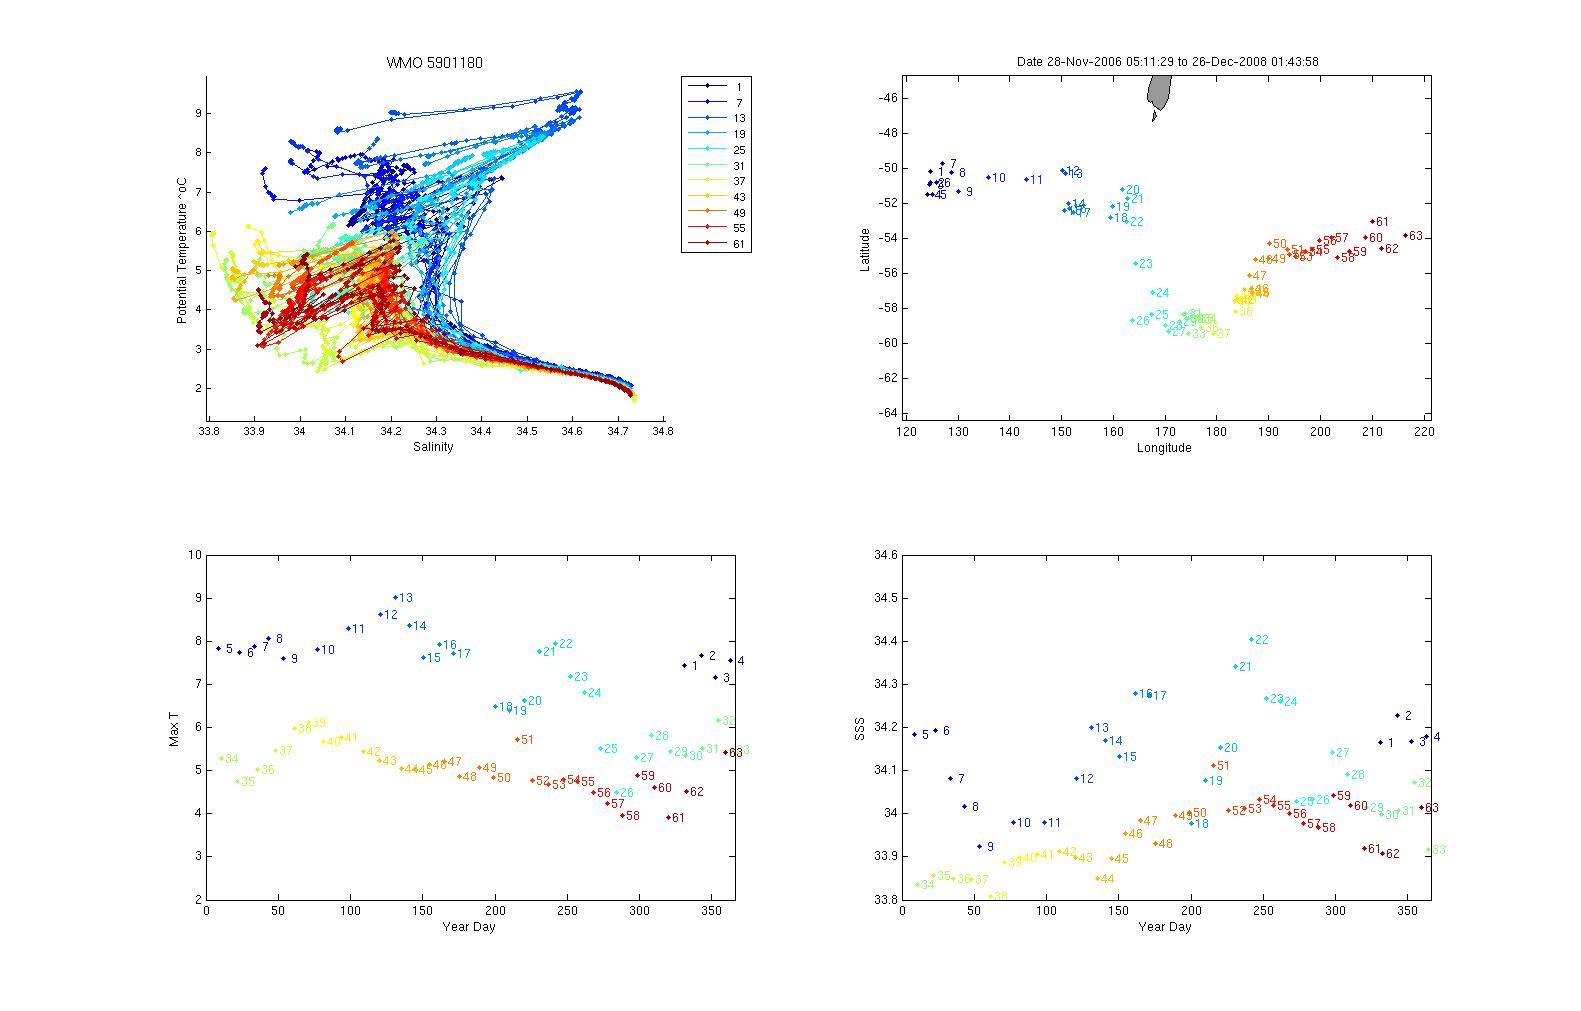
Surface temperatures generally varied between 3.8 and 9.2 şC and surface salinities from 33.8 to 34.45.
The plot below shows the potential-temperature/salinity relationship for the deepest theta levels where the relationship between the two parameters should show the least variation.
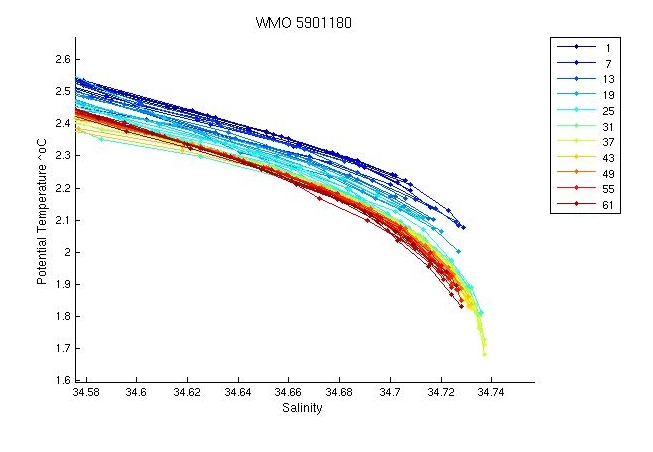
There is a large spread in the deep profiles with earlier profiles saltier than later profiles. The float has covered a considerable distance so this is probably real.
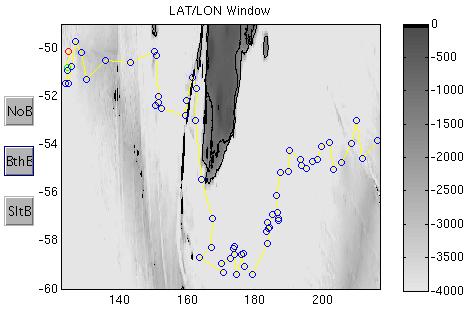
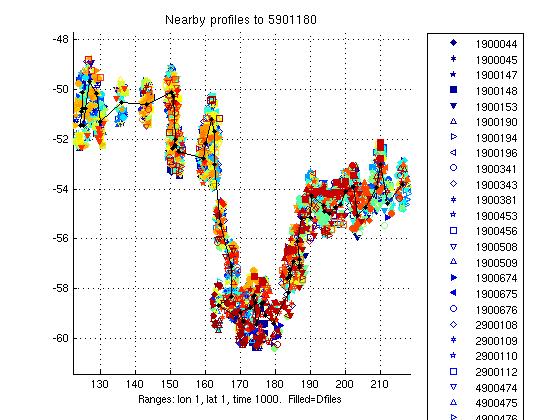
The two plots below show a). the location of this float (black circles) in relation to the position of other nearby argo floats (coloured circles) and b). The potential-temperature/salinity curve for this float (in black) compared to nearby argo floats (coloured).
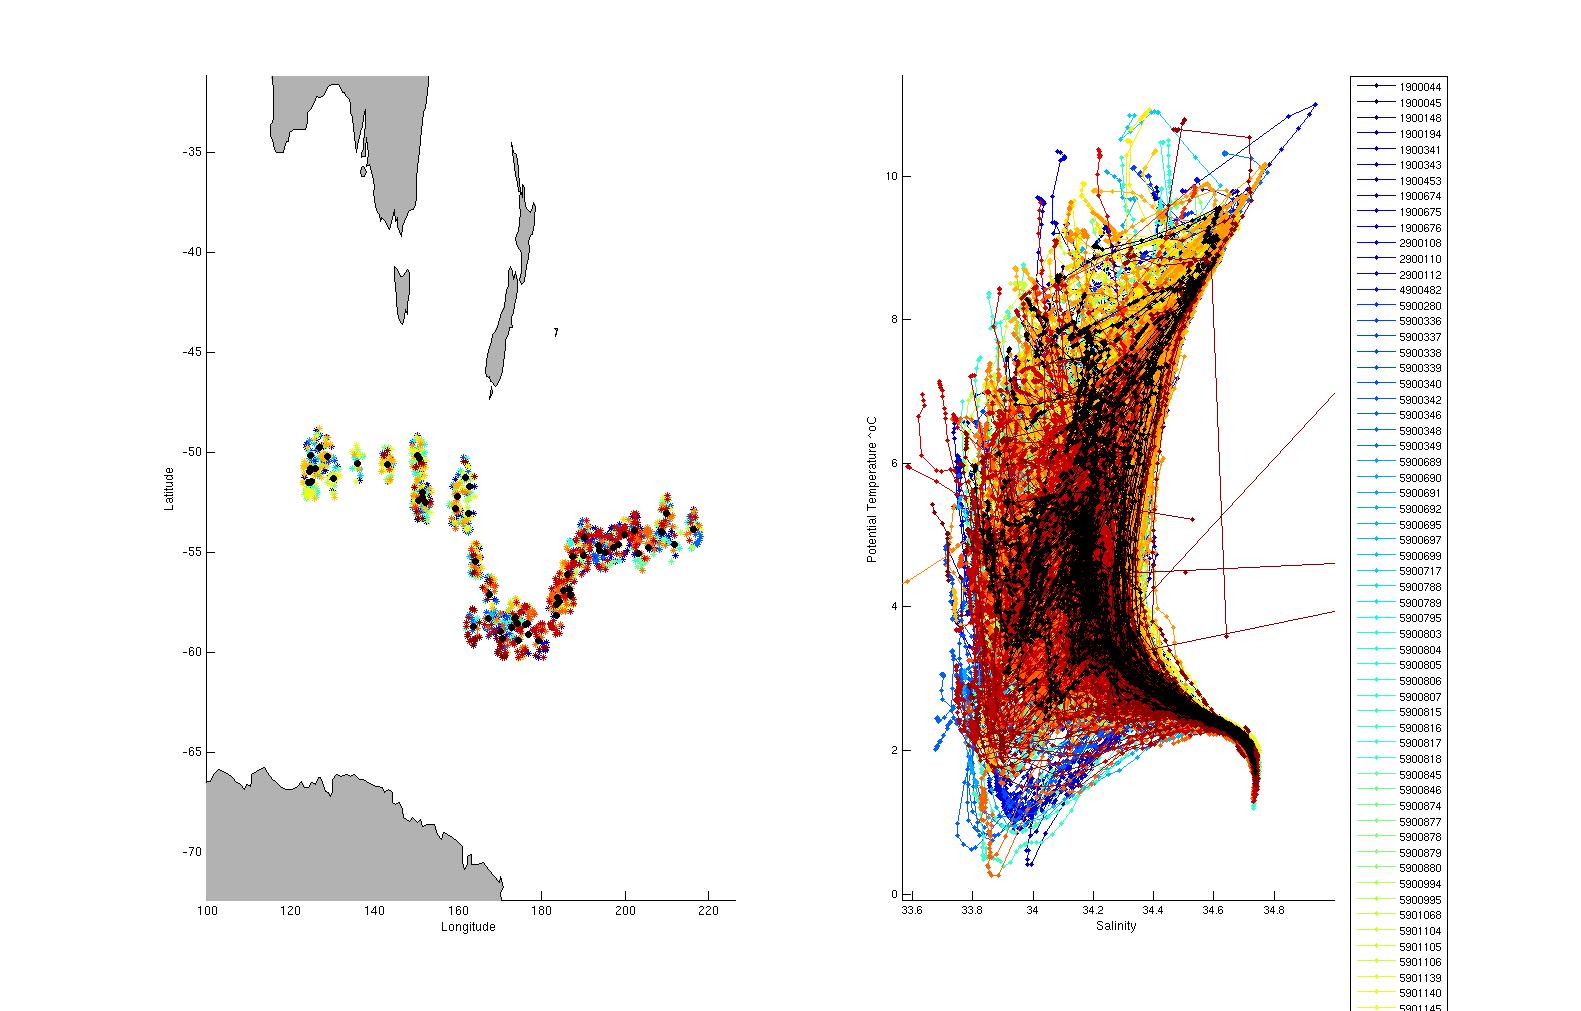
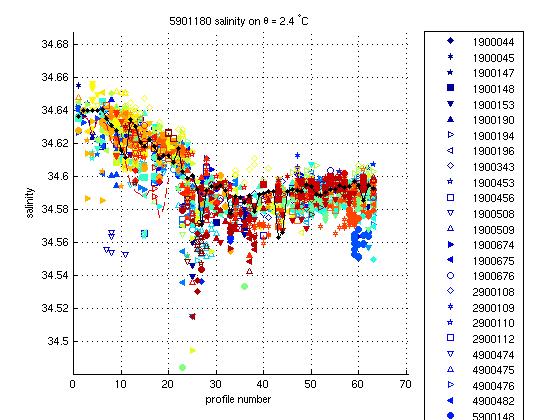
The potential-temperature/salinity relation for the deepest theta levels for this float (in black) and nearby argo floats (coloured) is displayed below.
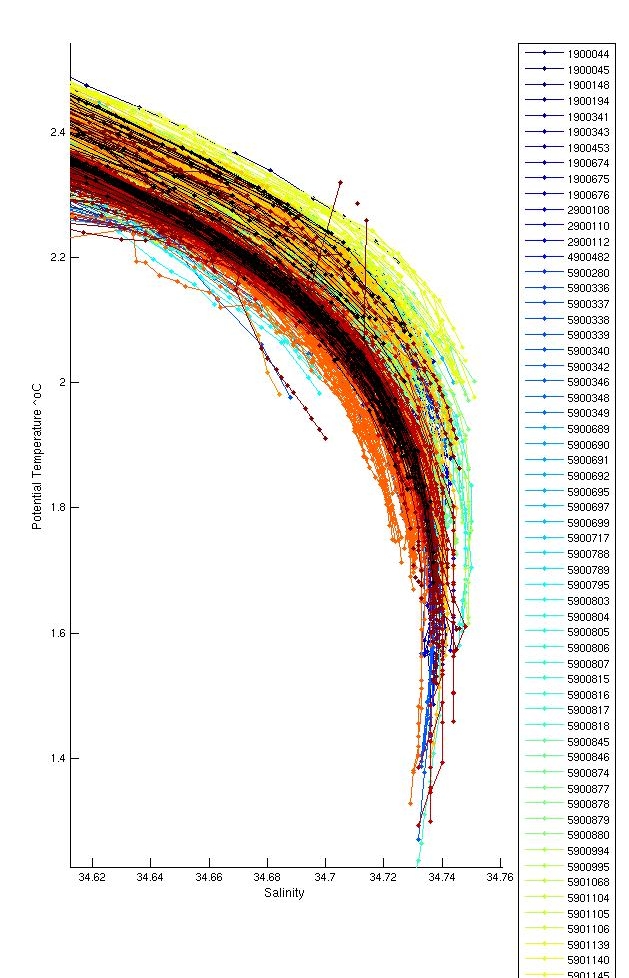
Even though the profiles cover such a huge spread this is reasonable given the distance covered. Compared to neighbouring profiles, the float looks fine.
There were inversions in profiles 1 (280 and 290 m depth, not significant), 28 (230 m depth, not significant), 33 (80 m depth, not significant), 38 (240 and 250 m depth, flagged as QC=4 for both T & S), and 53 (260 m and 500 m depth, both not significant).
Salt hooks were located in profiles; 11, 12, 13, 14, 15, 16, 17, 18, 19, 20, 21, 22, 23, 24, 25, 26, 27, 28, 29, 30, 31, 37, 38, 39, 40, 41, 42, 43, 44, 45, 46, 47, 48 and 51. These were flagged as QC=4 for both T & S.
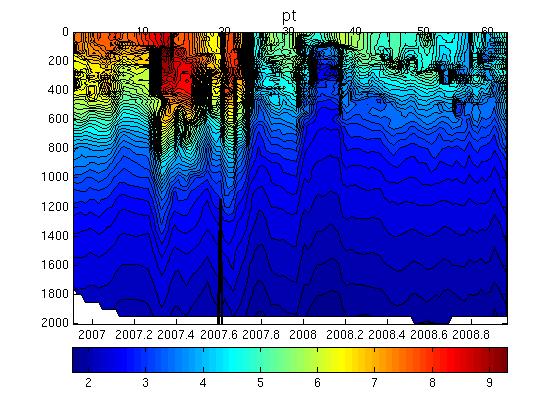
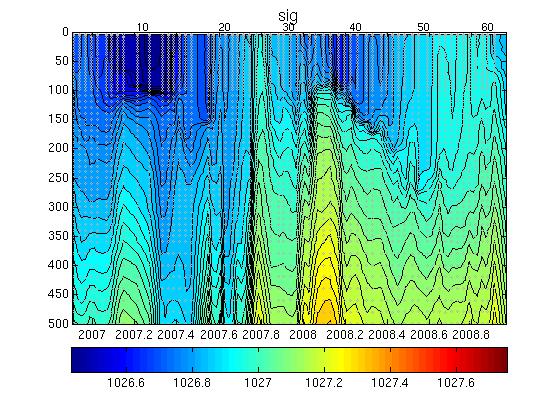
There are several shortened profiles. The irregular timing cyles may be causing the problem. See section plots.
The plot below shows the analysis of salinity drift using the WJO/OW software.

This float requires no correction.
The four plots below show the salinity anomalies on theta surfaces compared to (a) the Gouretski and Kolterman climatology, (b) the CARS (CSIRO Atlas of Regional Seas)/WOA (World Ocean Atlas) climatology, (c) the anomalies within the float series itself, (i.e. the salinity anomaly of each profile from the mean profile average for the float and (d) the raw float salinity compared to the CARS and G&K climatological salinity on a deep theta surface.
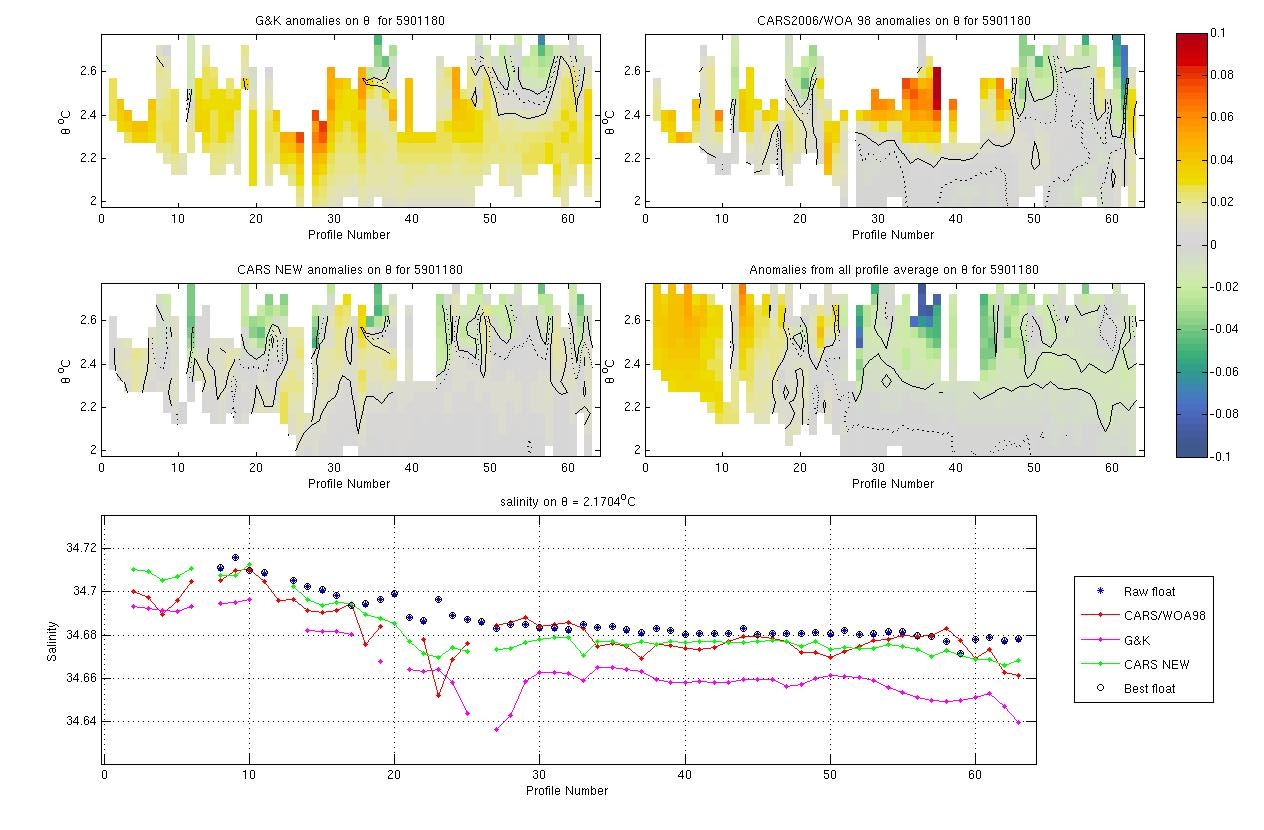
This float is very close to CARS NEW.
The float is in the middle of the nearby data envelope.
When comparing to nearby floats the variation is about 0.01 psu either side. When looking at the latter half of the series i.e. from profile 25 through 50 this float appears to be at the upper end of the spectrum but when you look at the adjusted data, three of the lower salinity spectrum floats (not ours; 5900321, 5900217 and 5900214) have been adjusted upwards. Therefore am inclined to leave this float as is.
This float required no salinity drift correction.
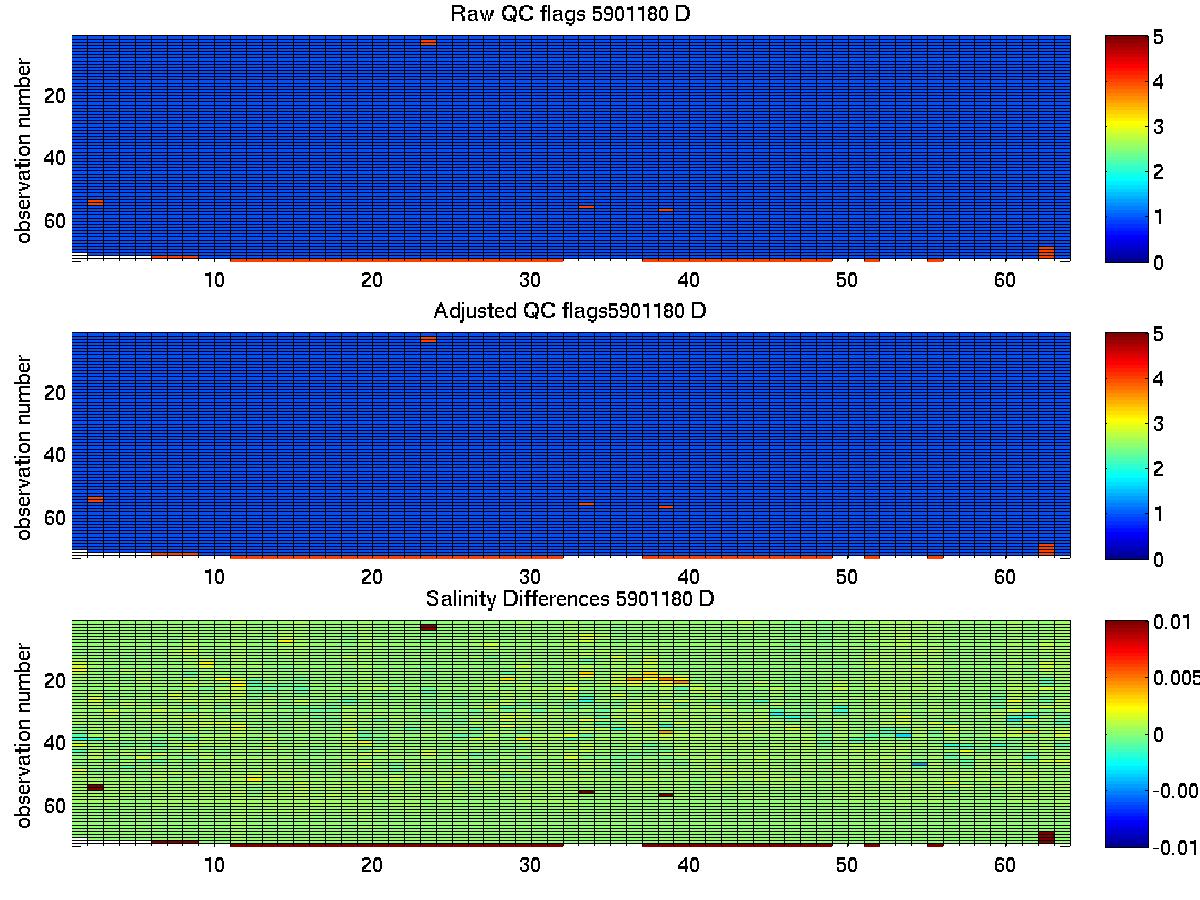
The plot below summarises the QC flags and salinity differences for the raw and adjusted salinity fields in the final delayed mode files submitted to the GDAC.
Created 06-07-2009