The table below provides basic information about the float, including primary sensors, mission parameters and current status of profiles.
| Institute | CSIRO |
| Principal Investigator | Susan Wijffels |
| Pressure Sensor | Druck (serial number=7909) |
| CTD Sensor | APEX-SBE-41 (serial number=2300) |
| CTD Sampling Mode | Burst Sampler |
| Controller Board | APF 8 |
| Additional Sensors/Software | None |
| Park Depth | 1000 m |
| Profile Depth | 2000 m |
| Launch Date | 13-08-2006 |
| Number of D-moded Profiles | 129 |
| Calibration Date | 01-09-2010 |
| Pressure Drift | Surface Pressure Offset corrected |
| Salinity Drift | Gross salinity offset and drift detected, cannot be corrected |
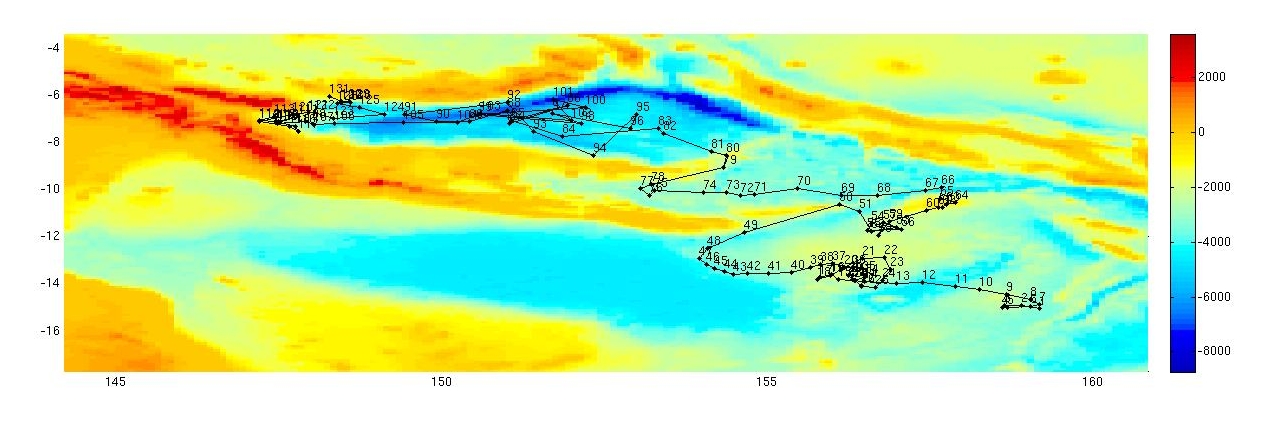
This float was located in the Coral Sea in an area bounded by 149 to 159 şE and 6 to 16 ş S.
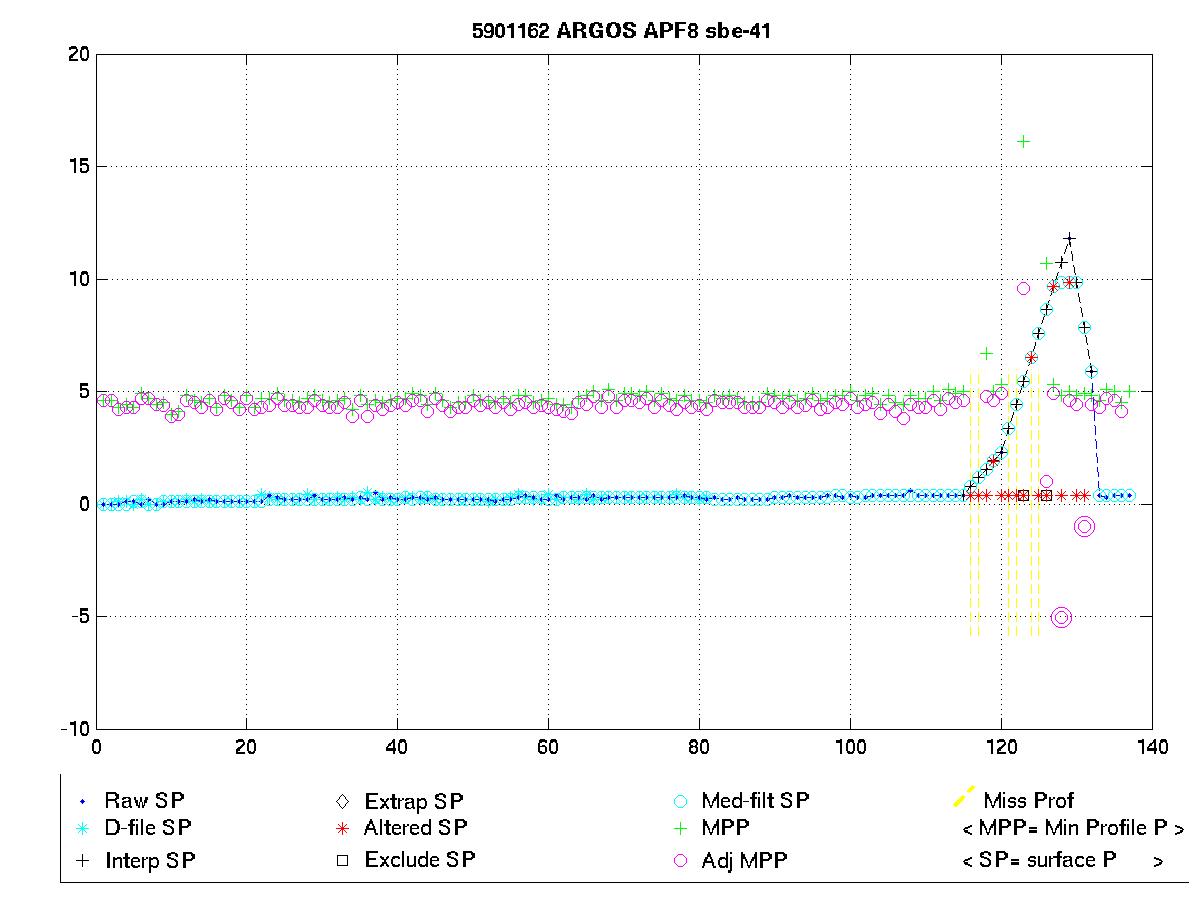
The surface pressure for this float is shown in the plot below.
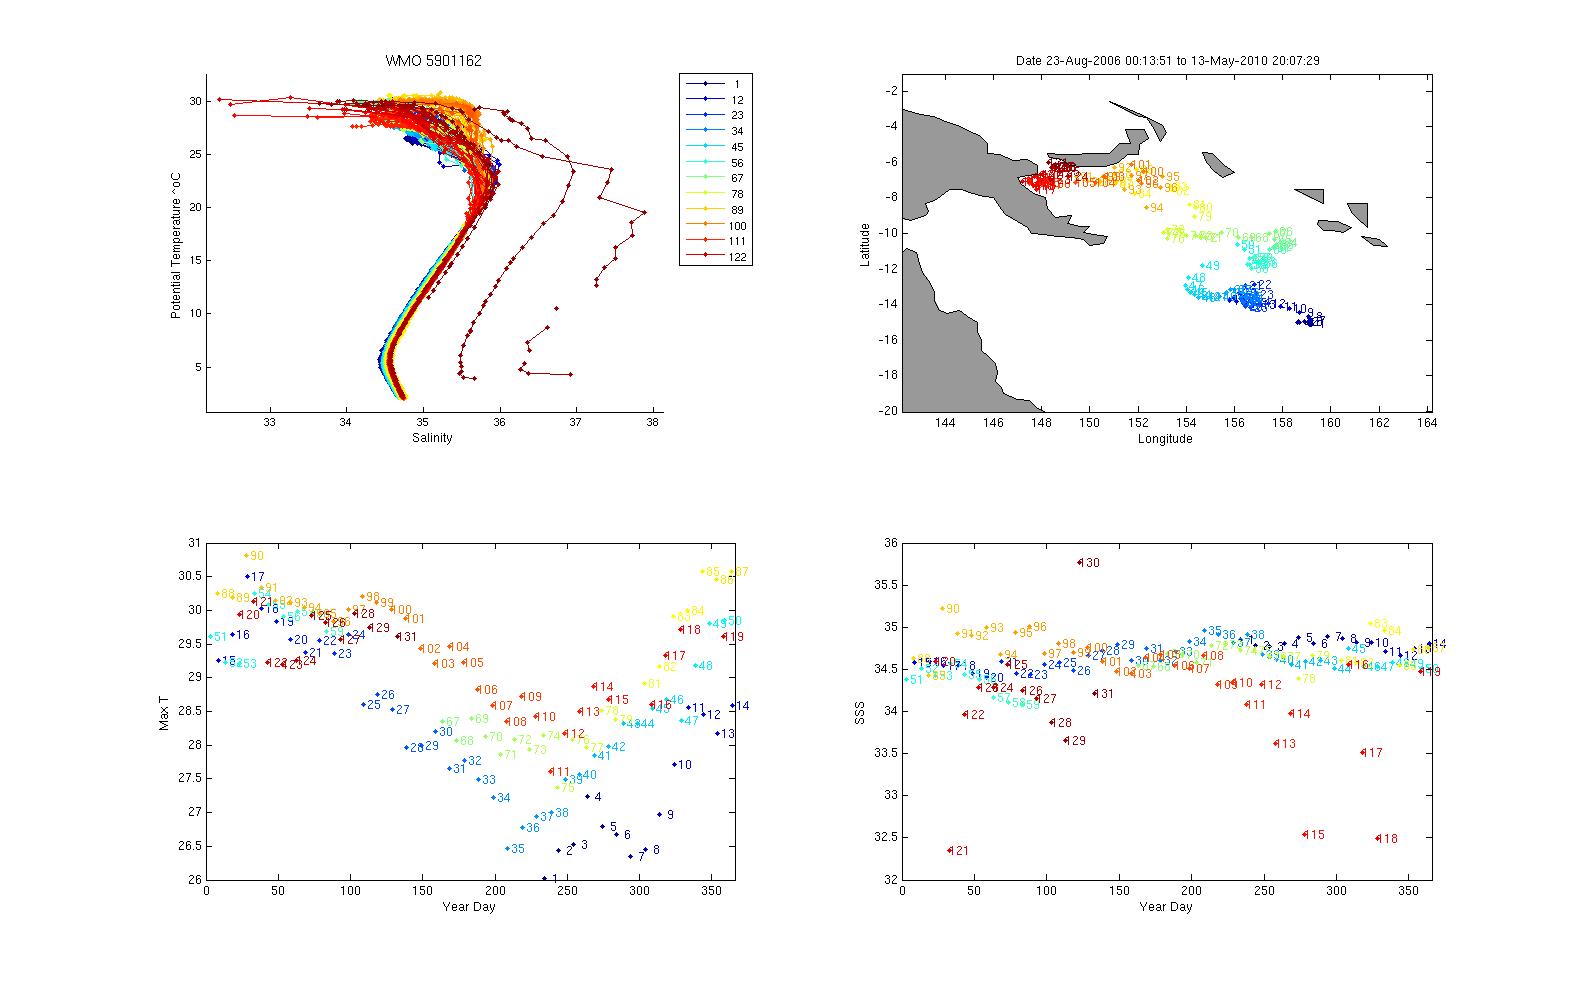
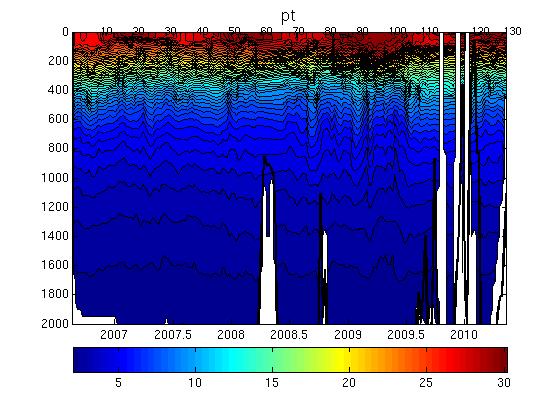
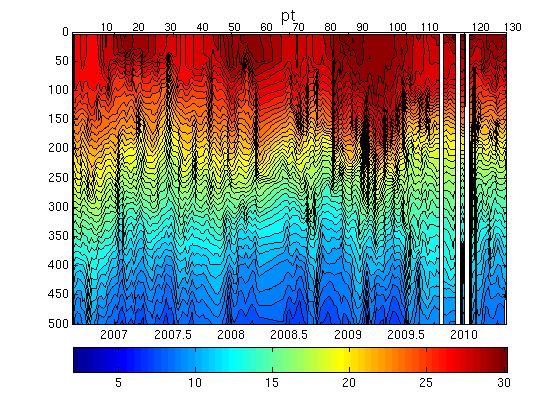
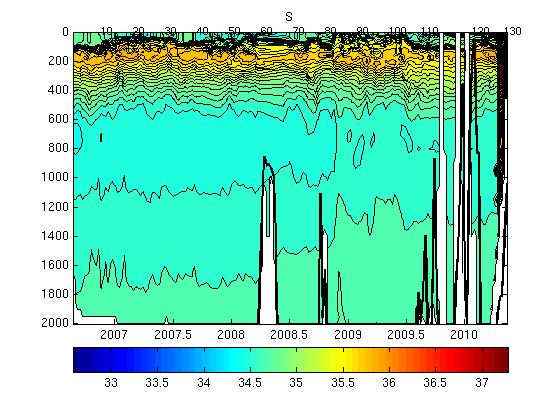
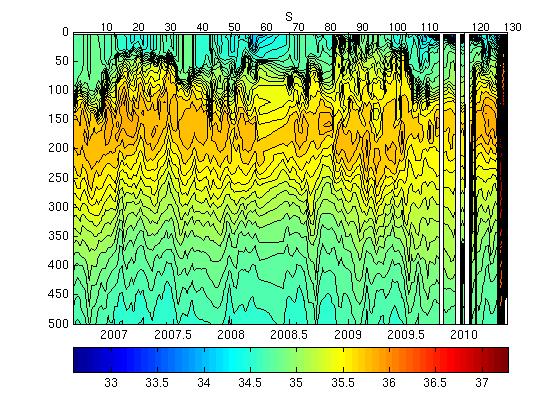
Potential Temperature-Salinity (a), Location (b, Max Temperature (c) and Sea Surface Salinity (d) plots located below.
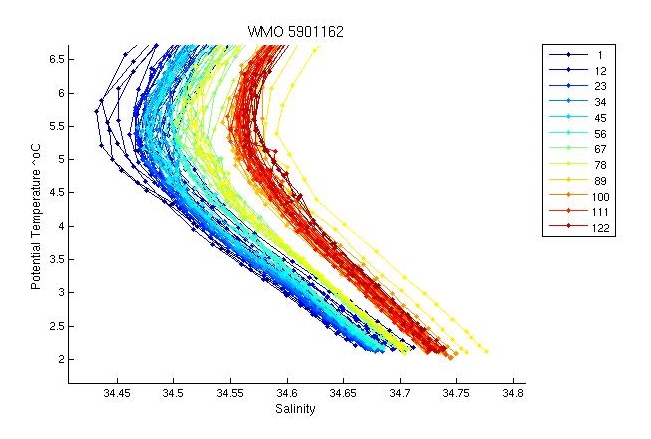
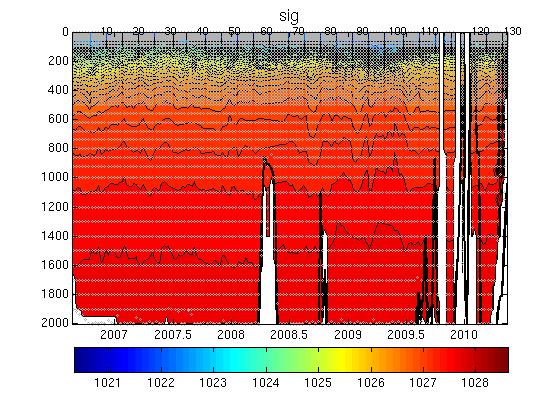
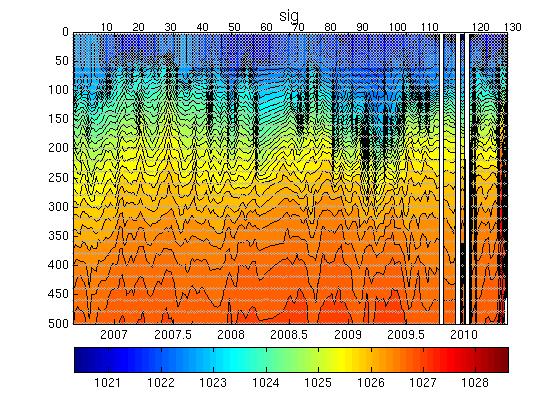
The plot below shows the potential-temperature/salinity relationship for the deepest theta levels where the relationship between the two parameters should show the least variation.
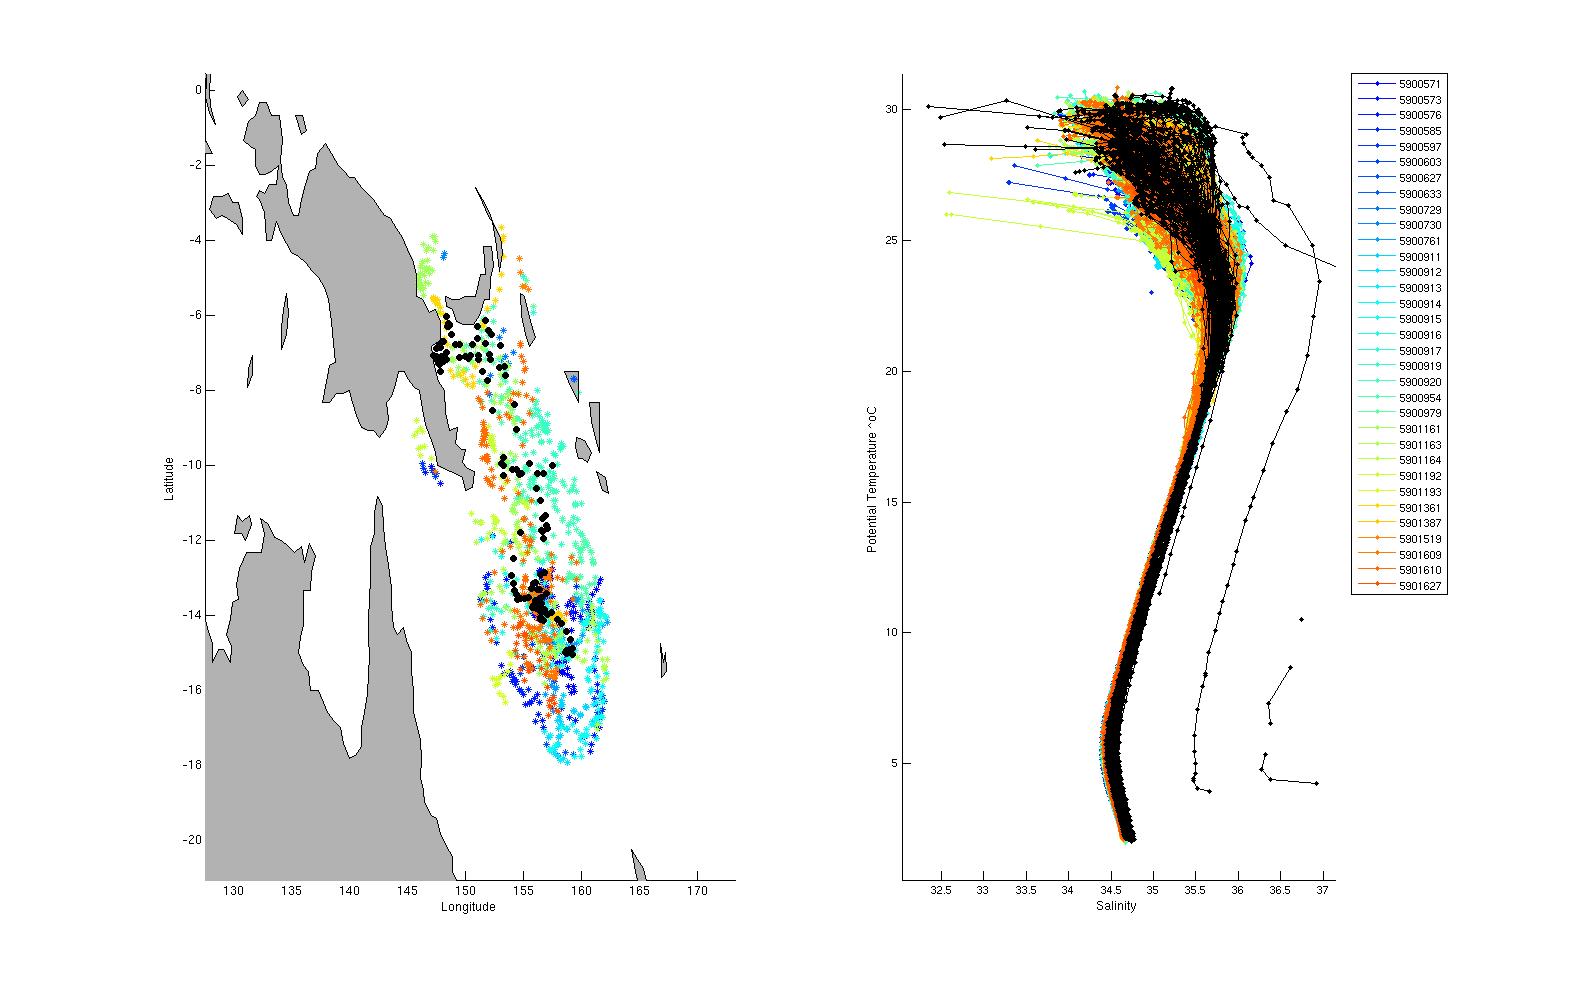
The two plots below show a). the location of this float (black circles) in relation to the position of other nearby argo floats (coloured circles) and b). The potential-temperature/salinity curve for this float (in black) compared to nearby argo floats (coloured).
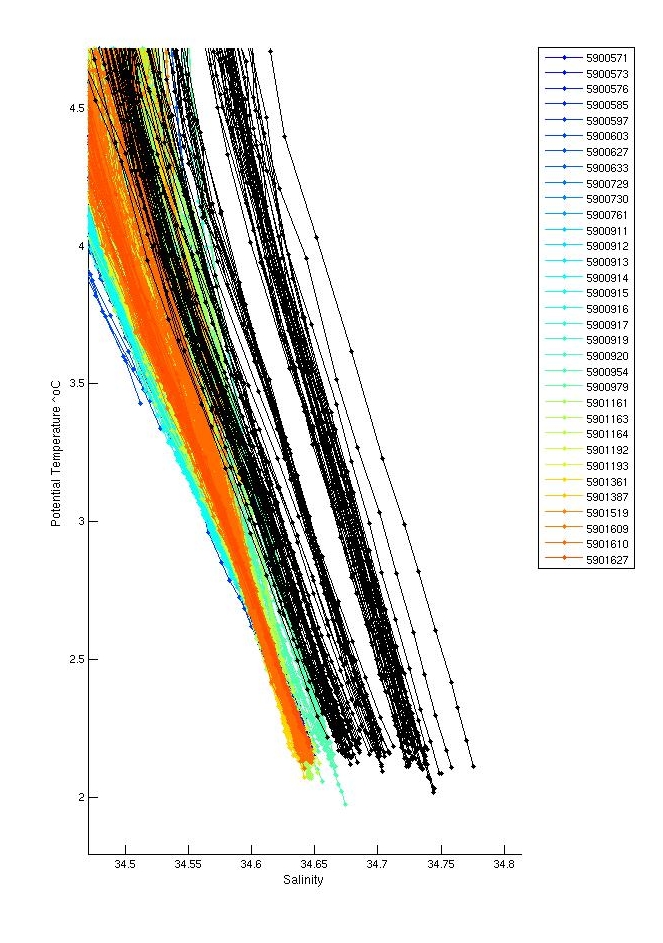
The potential-temperature/salinity relation for the deepest theta levels for this float (in black) and nearby argo floats (coloured) is displayed below.
There were no inversions.
Salt hooks were located in profiles; 7,9,11,14,16,18,20,24,26,28,32,33,35,36,39,40,41,43,45,47,49,51,53,55,57,59,66,67,68,69,70,71,72,73,75,77,79,81. These were flagged as QC 4 for both T & S.
There were no missing profiles. The float grounded on profiles; 60 and beyond. Many profiles are obviously bad after grounding, i.e. pf 60,61,62,63,64,65,66 and 80. Early profiles look like they also have issues - much saltier than the rest when compared to nearby TS profiles - check this further with nearby argo below. No evidence that this is caused by pressure drift.
The plot below shows the analysis of salinity drift using the OW software.

The four plots below show the salinity anomalies on theta surfaces compared to (a) the Gouretski and Kolterman climatology, (b) the CARS (CSIRO Atlas of Regional Seas)/WOA (World Ocean Atlas) climatology, (c) the anomalies within the float series itself, (i.e. the salinity anomaly of each profile from the mean profile average for the float and (d) the raw float salinity compared to the CARS and G&K climatological salinity on a deep theta surface.
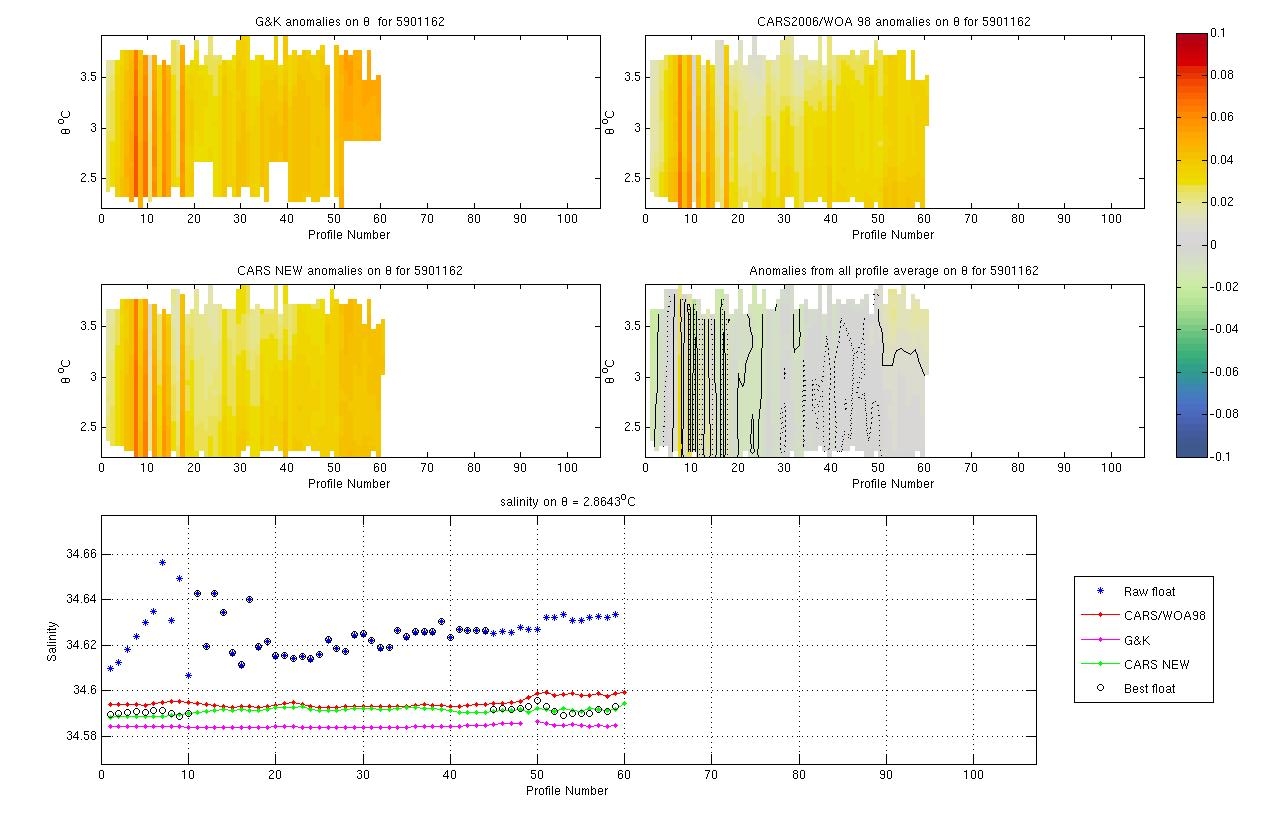
This is a problem float - salty offset from start by 0.02 and later by 0.06. The profiles are also highly erratic - arguable as to whether we can correct any of this.
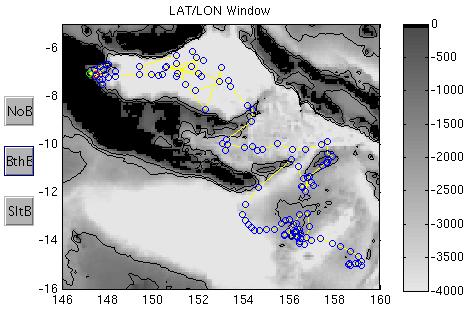
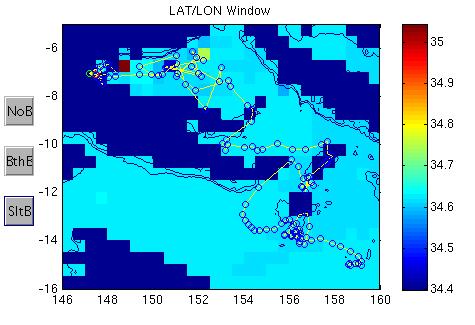
The plots below show the raw float salinity data (solid blue line) compared to neighbouring argo floats (coloured symbols) on a deep potential temperature surface. The locality map shows the location of the profiles for this float and for neighbouring floats.
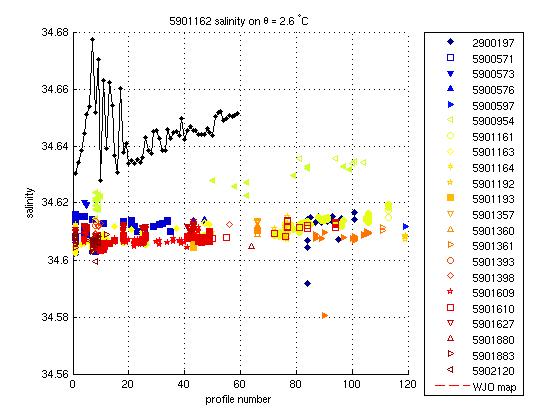
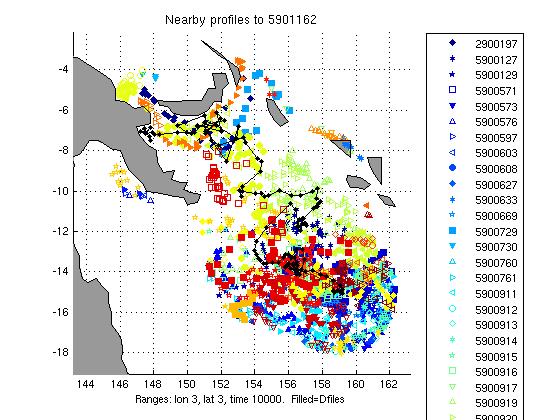
This comparison shows that the float is salt offset from the start and that this gets worse over time. The offset may not be constant through the water column. QC all profiles as 4.
This float has a salt offset and drift and salinity data cannot be corrected.
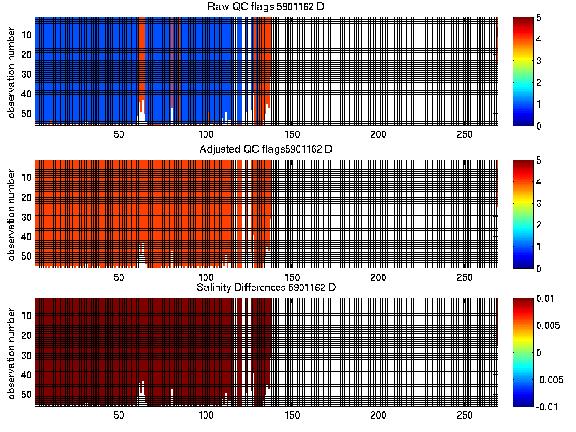
The plot below summarises the QC flags and salinity differences for the raw and adjusted salinity fields in the final delayed mode files submitted to the GDAC.
Created 01-09-2010