The table below provides basic information about the float, including primary sensors, mission parameters and current status of profiles.
| Institute | CSIRO |
| Principal Investigator | Susan Wijffels |
| Pressure Sensor | Druck (serial number=5619) |
| CTD Sensor | APEX-SBE-41 (serial number=1495) |
| CTD Sampling Mode | Burst Sampler |
| Controller Board | APF 8 |
| Additional Sensors/Software | None |
| Park Depth | 1000 m |
| Profile Depth | 2000 m |
| Launch Date | 15-02-2005 |
| Number of D-moded Profiles | 155 |
| Calibration Date | 08-12-2010 |
| Pressure Drift | Surface Pressure Offset unknown and uncorrectable from profile 1 onwards, TNDP float, QC=2, serial number < 2324175 |
| Salinity Drift | No salinity drift detected for profiles 1 to 134, significant fresh offset from pf 135 onwards, anomalous data |
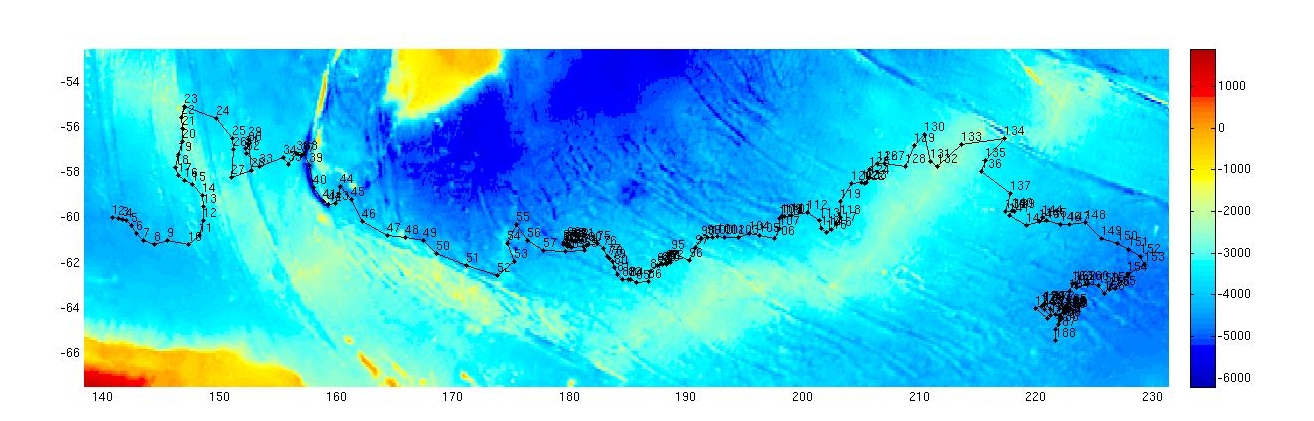
This float was located in the Southern Ocean, to the south of Tasmania, NZ and into the South Pacific, in an area bounded by 140 şE to 130 şW and 54 to 64 ş S.
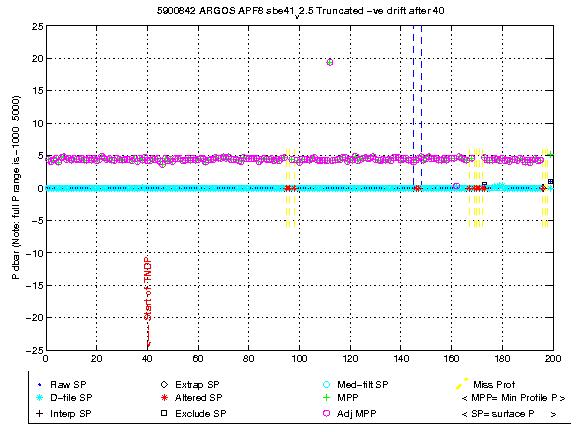
The surface pressure for this float is shown in the plot below.
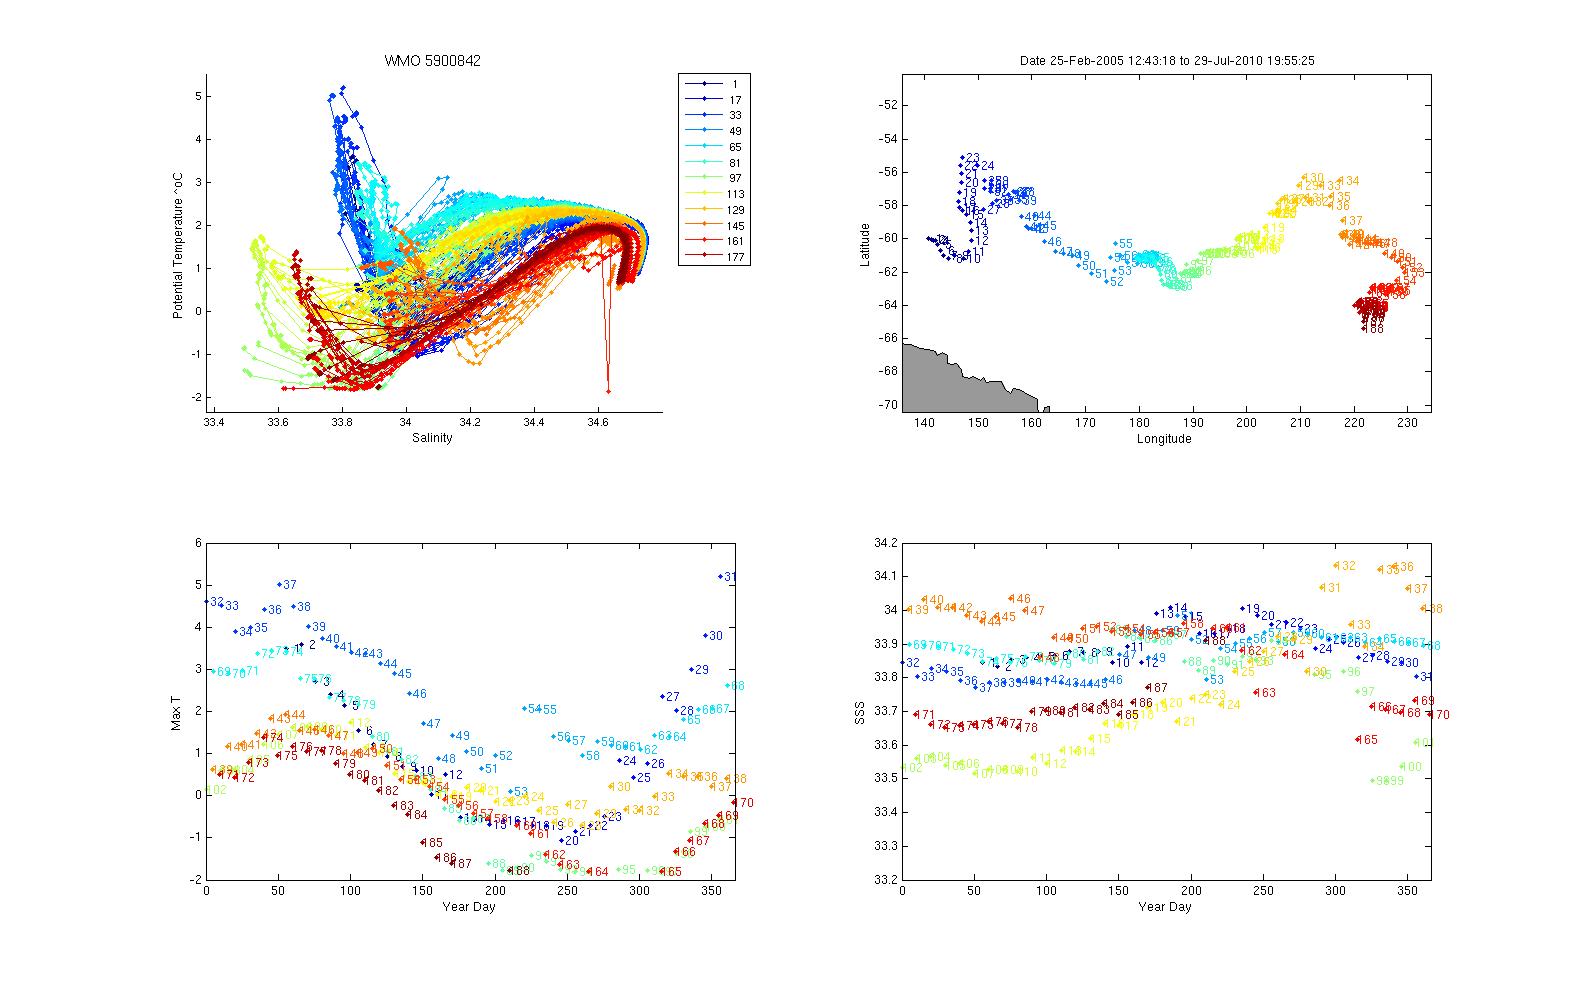
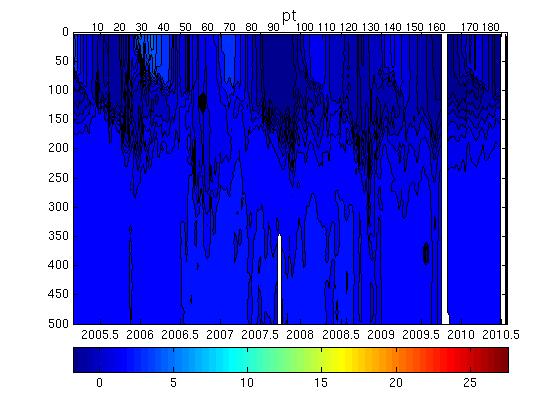
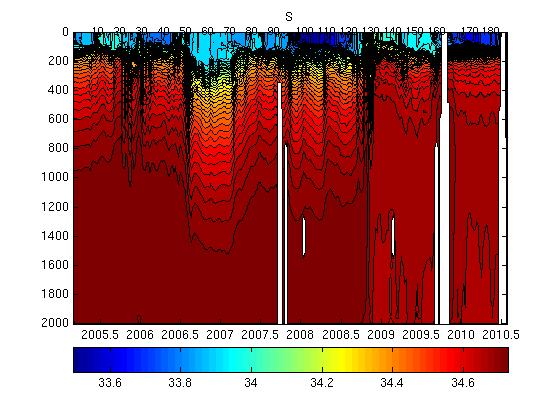
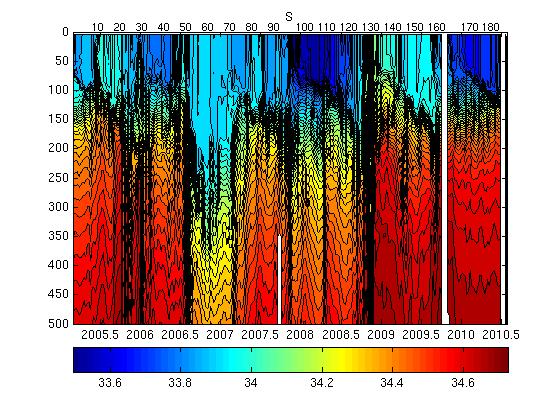
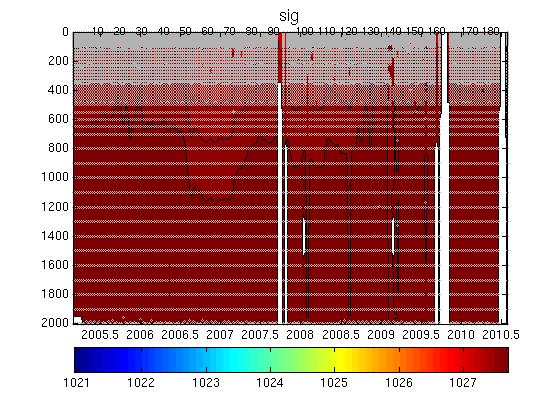
Potential Temperature-Salinity (a), Location (b, Max Temperature (c) and Sea Surface Salinity (d) plots located below.
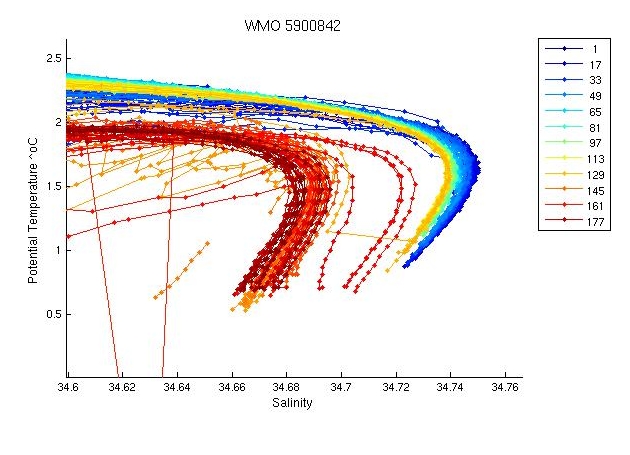
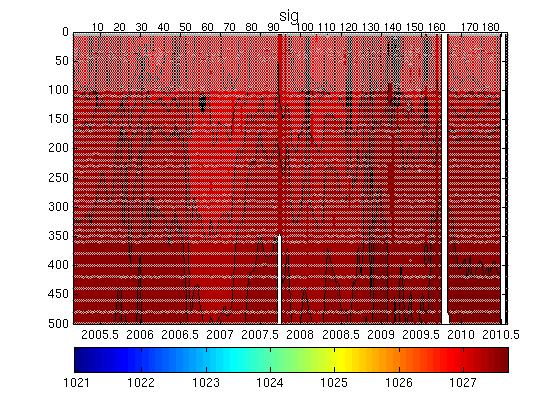
The plot below shows the potential-temperature/salinity relationship for the deepest theta levels where the relationship between the two parameters should show the least variation.
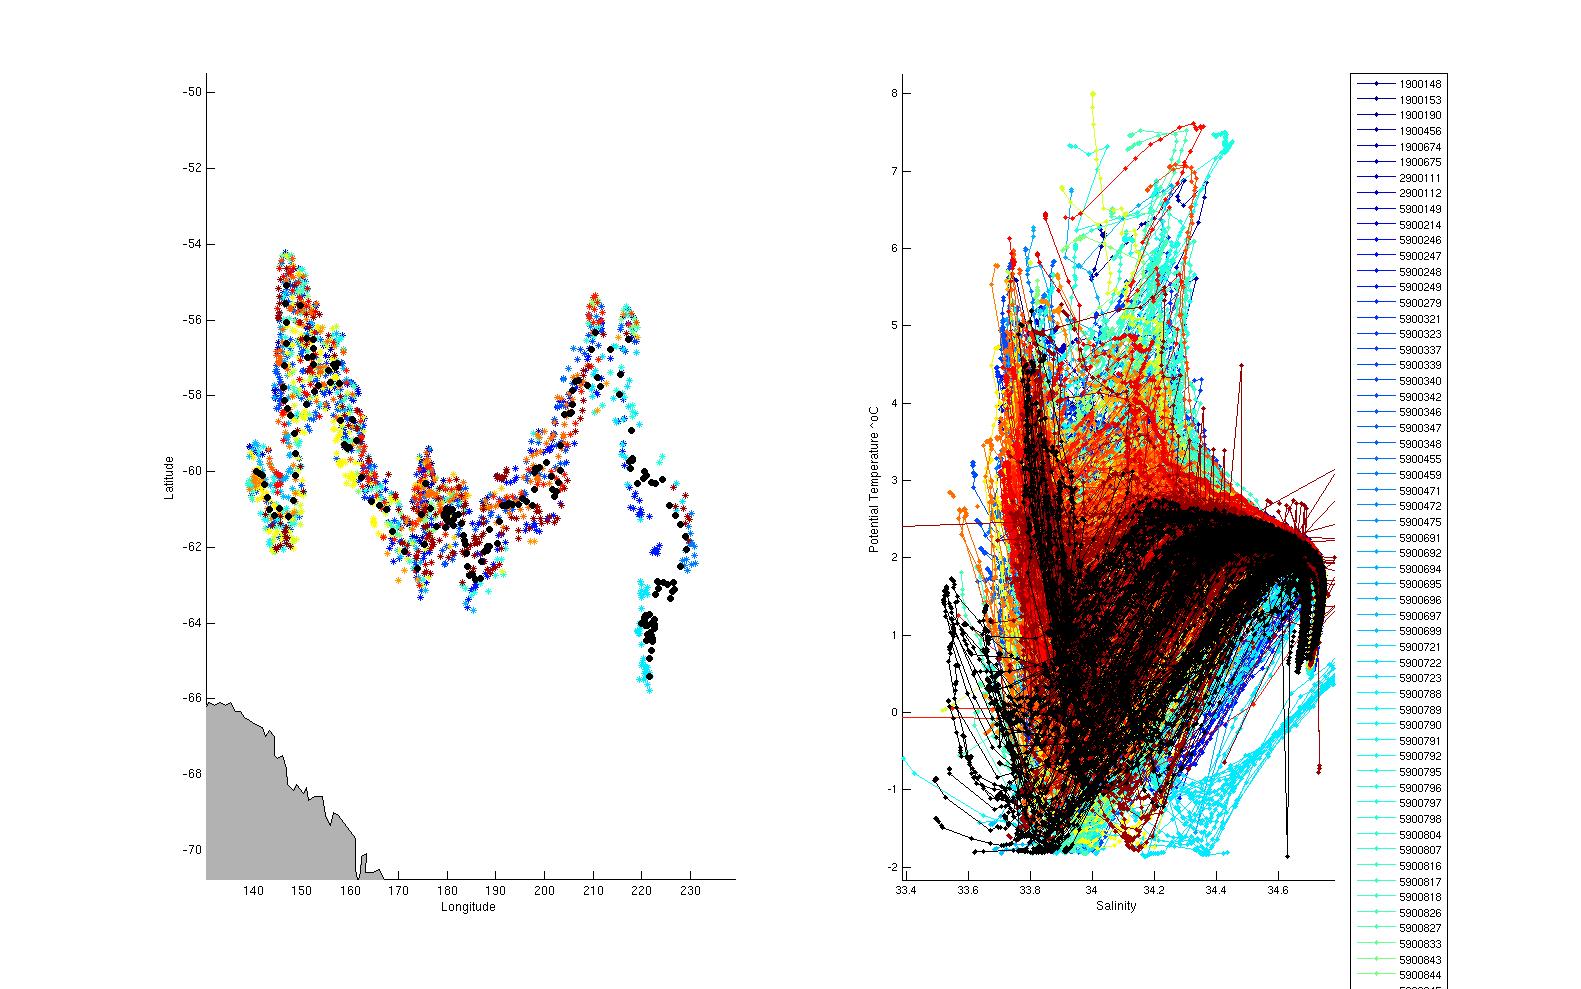
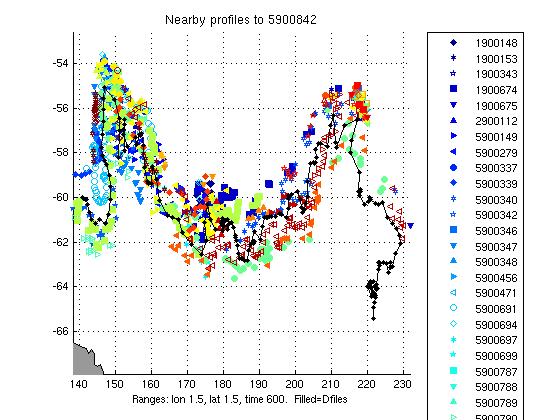
The two plots below show a). the location of this float (black circles) in relation to the position of other nearby argo floats (coloured circles) and b). The potential-temperature/salinity curve for this float (in black) compared to nearby argo floats (coloured).
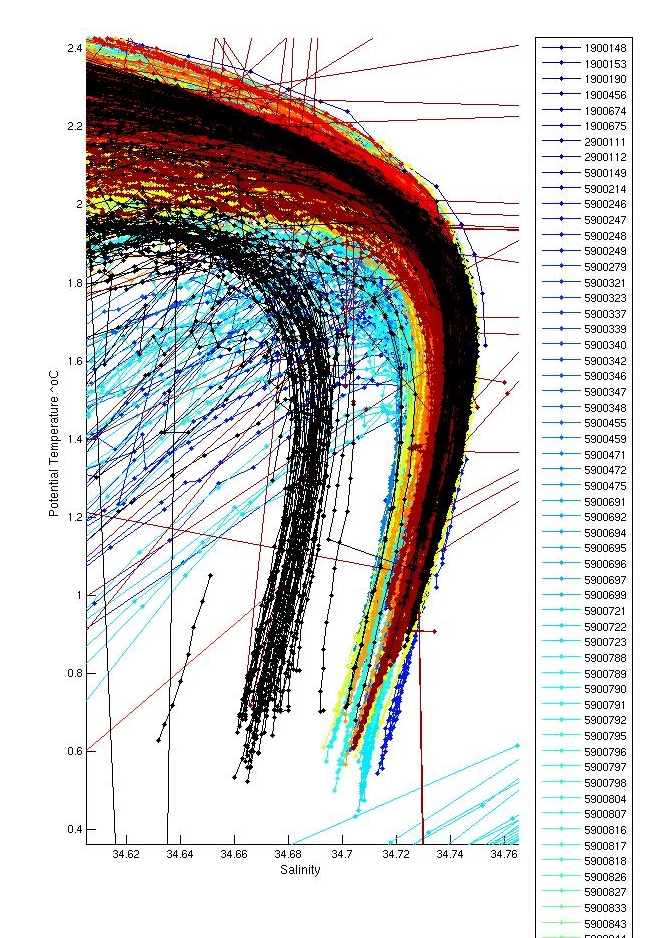
The potential-temperature/salinity relation for the deepest theta levels for this float (in black) and nearby argo floats (coloured) is displayed below.
There were inversions in profiles; 1,4,5,30,35,46,70,82,114,137,143 (missing data),145 (missing data). None of these were significant and therefore were not flagged. Check profiles 154, spike in salinity at 125 m, pf 162 flag spike in temp and sal at 380 m and 600 m.
Salt hooks were located in profiles; 1,3,5,6,8,10,12,16,18,20,22,23,26,28,30,31,34,36,38,40,42,44,46,48,50,51,53,58,59,61,65,68,71,73,77,79,81,83,85,87,89,91,93,97,99,101,103,105,107,109,111,115,117,119,121,122,124. These were flagged as QC 4 for both T & S.
Multiple bad pressure values, noisy data QC'd as 4. A few near bottom values were flagged as QC4.
The plot below shows the analysis of salinity drift using the OW software.

The four plots below show the salinity anomalies on theta surfaces compared to (a) the Gouretski and Kolterman climatology, (b) the CARS (CSIRO Atlas of Regional Seas)/WOA (World Ocean Atlas) climatology, (c) the anomalies within the float series itself, (i.e. the salinity anomaly of each profile from the mean profile average for the float and (d) the raw float salinity compared to the CARS and G&K climatological salinity on a deep theta surface.
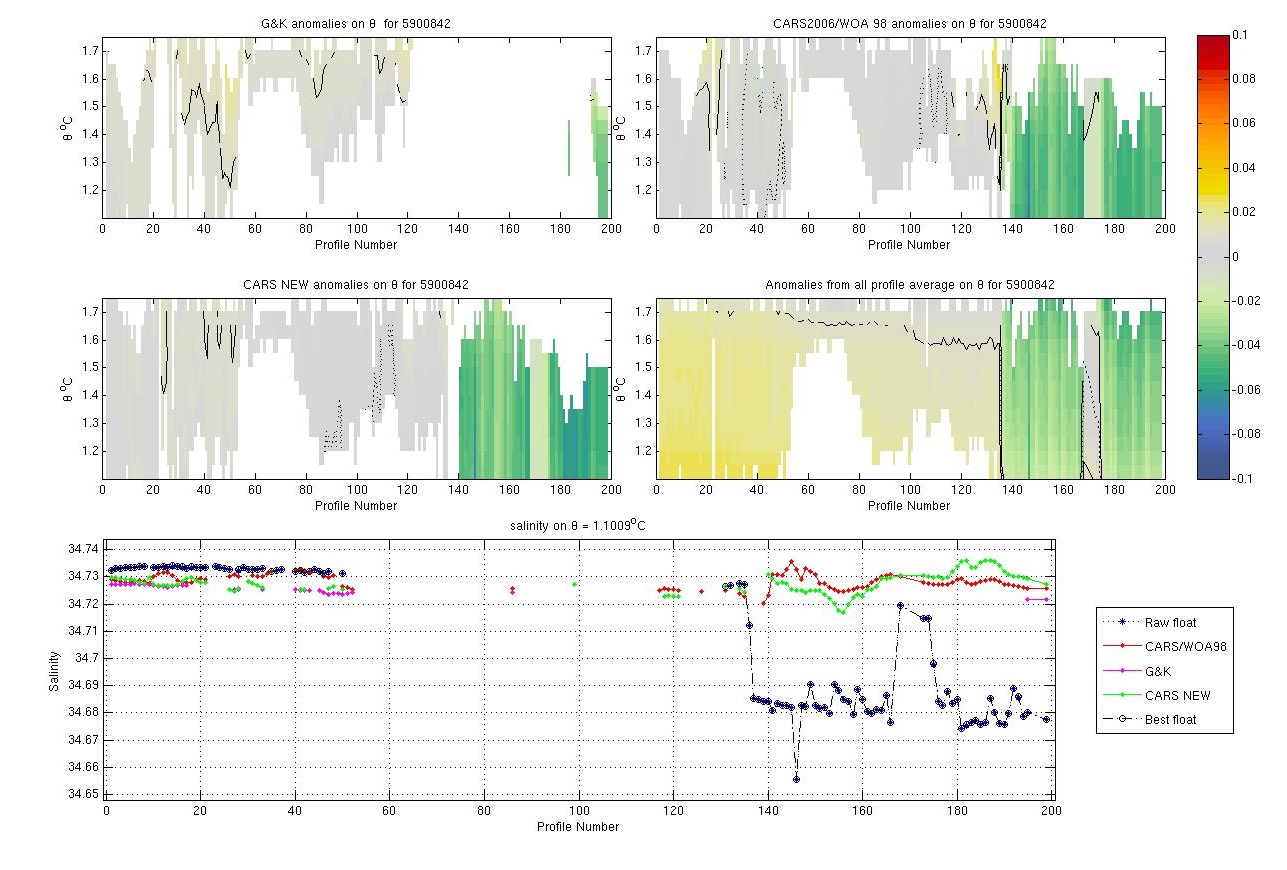
This float appears to be in calibration from pf 1 to 134, after this it is likely the float suffered damage and is fresh offset, PSAL_ADJUSTED set to QC4.
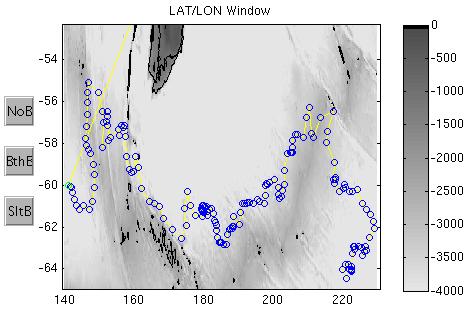
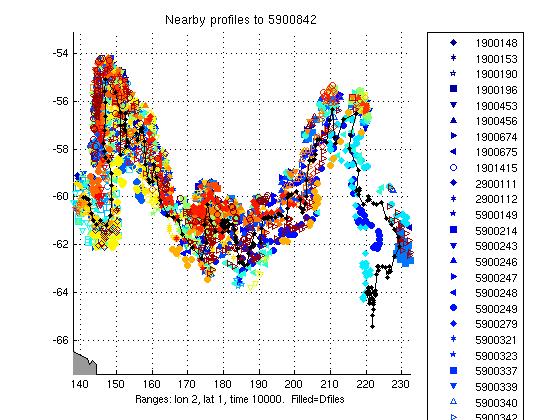
The plots below show the raw float salinity data (solid blue line) compared to neighbouring argo floats (coloured symbols) on a deep potential temperature surface. The locality map shows the location of the profiles for this float and for neighbouring floats.
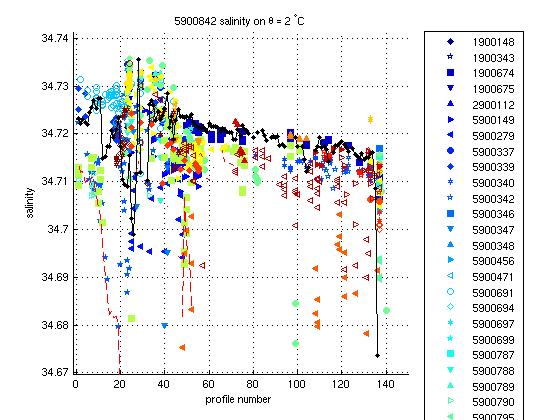
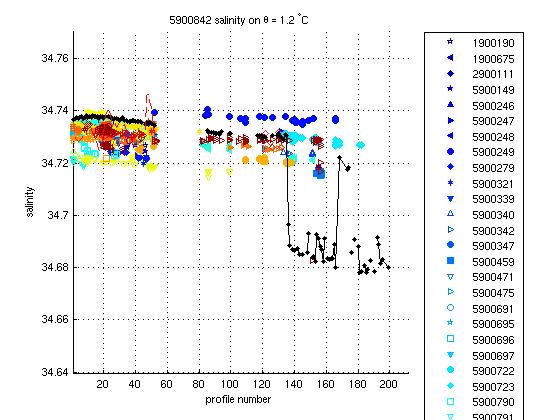
This float shows no salinity drift for profiles 1 to 134, after this it is significantly fresh offset. Comparison at lower theta levels show that there are no neighbouring floats that are this fresh (i.e. by about 0.04 to 0.05) therefore we think this float has probably suffered some kind of damage.
This float required no salinity drift correction for profiles 1 to 134, extra climatological data checks show that profiles 135 onwards are fresh offset compared to other data from the region thus PSAL_ADJUSTED set to QC=4.
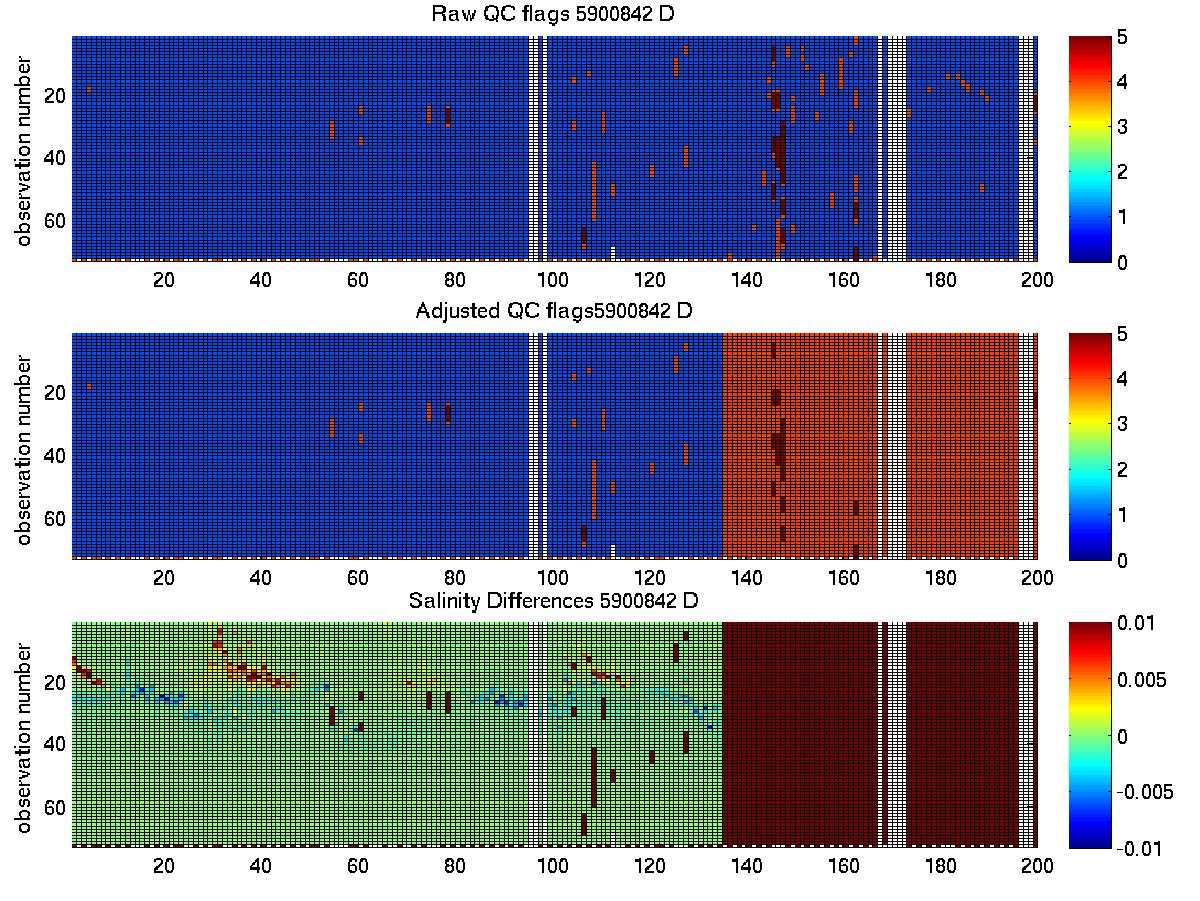
The plot below summarises the QC flags and salinity differences for the raw and adjusted salinity fields in the final delayed mode files submitted to the GDAC.
Created 10-Dec-2010