The table below provides basic information about the float, including primary sensors, mission parameters and current status of profiles.
| Institute | CSIRO |
| Principal Investigator | Susan Wijffels |
| Pressure Sensor | Druck (serial number=6749) |
| CTD Sensor | APEX-SBE-41 (serial number=1886) |
| CTD Sampling Mode | Burst Sampler |
| Controller Board | APF 8 |
| Additional Sensors/Software | Ice detection software |
| Park Depth | 1000 m |
| Profile Depth | 2000 m |
| Launch Date | 13-02-2005 |
| Number of D-moded Profiles | 217 |
| Calibration Date | 28-07-2011 |
| Pressure Drift | Surface Pressure Offset corrected |
| Salinity Drift | No salinity drift detected |
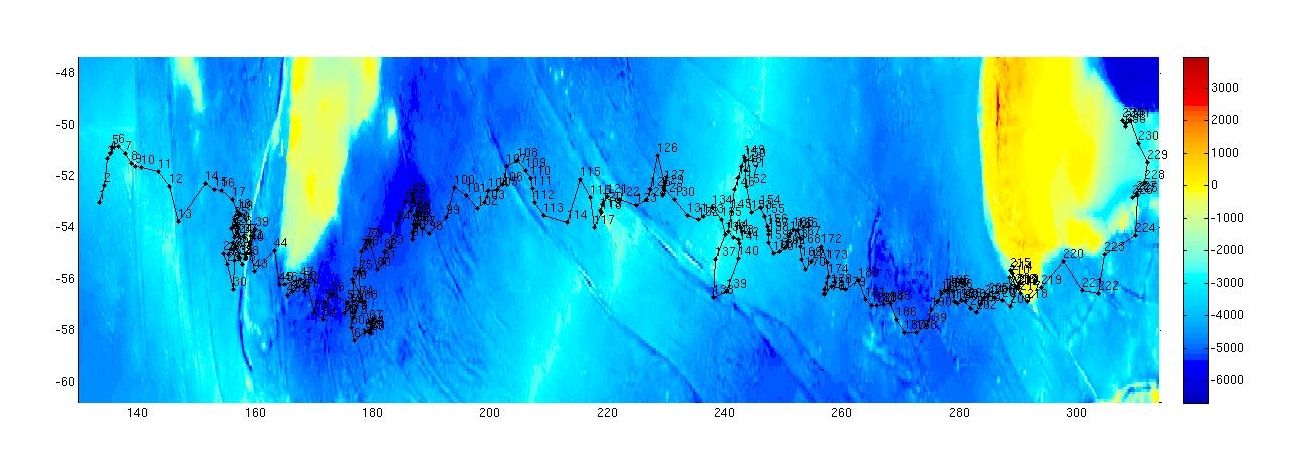
This float was located in the Southern Ocean, south of Australia, New Zealand and the South Pacific sector, in an area bounded by 135 şE to 40 şW and 45 to 60 şS.
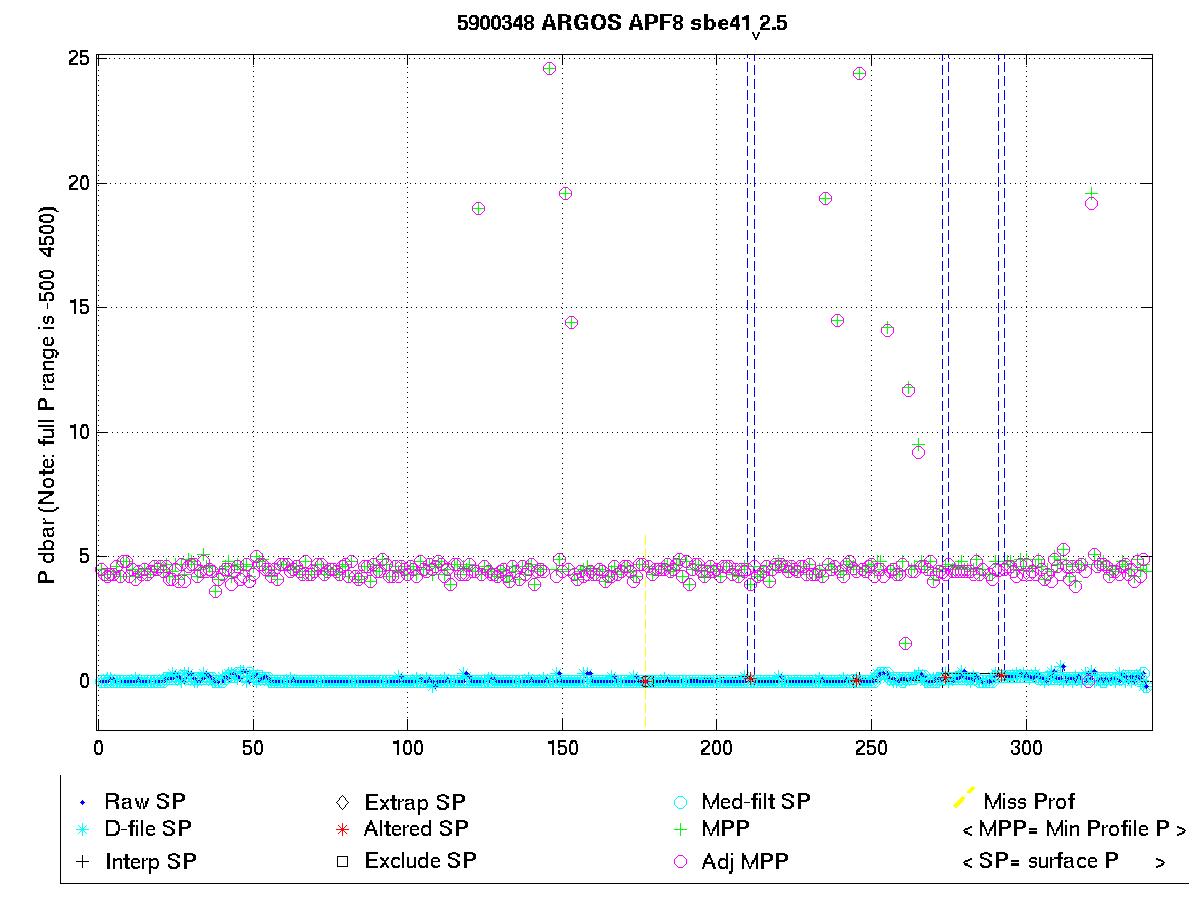
The surface pressure for this float is shown in the plot below.
Potential Temperature-Salinity (a), Location (b, Max Temperature (c) and Sea Surface Salinity (d) plots located below.
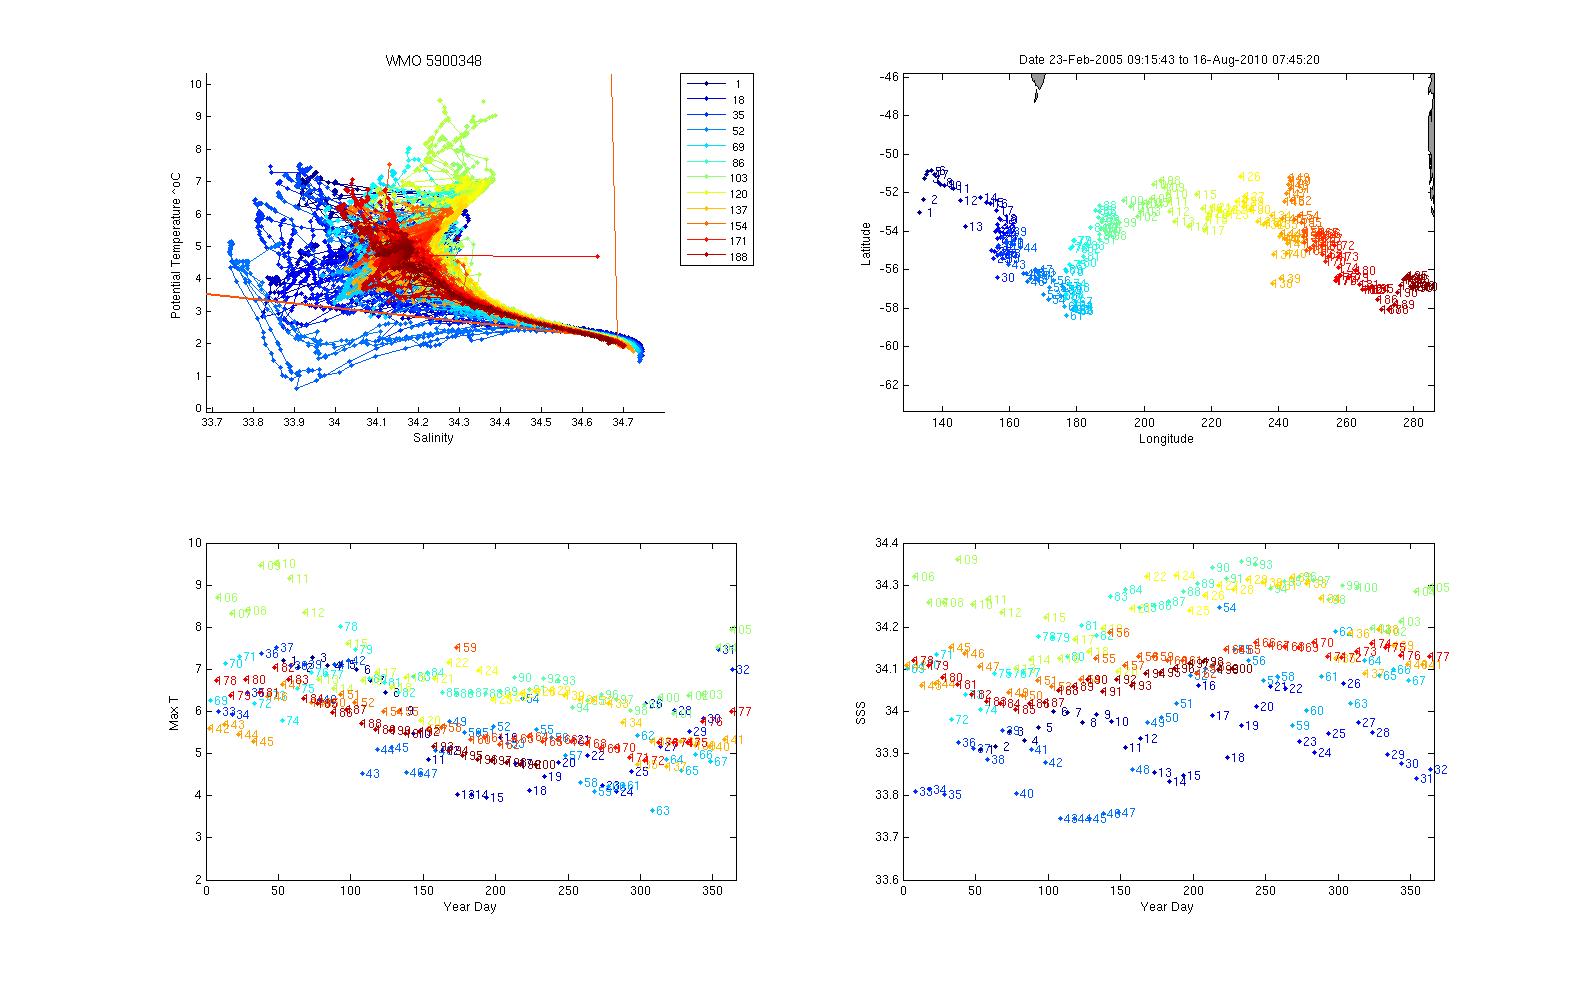
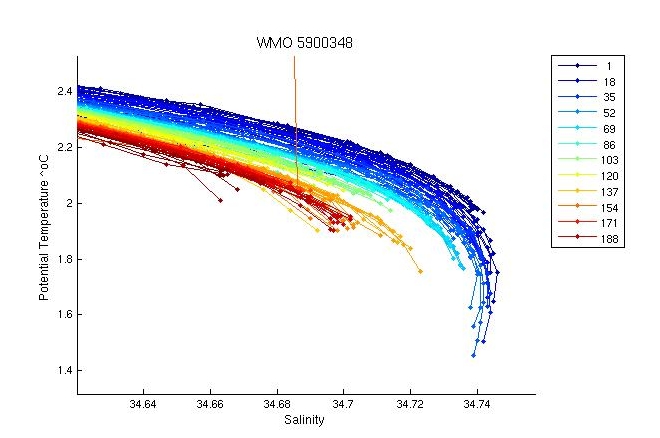
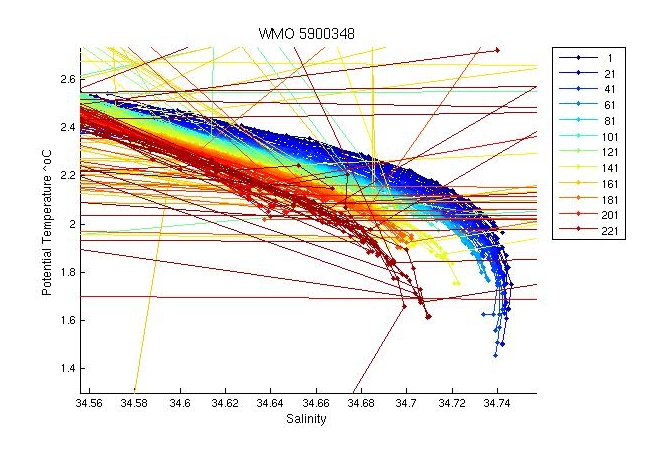
The plot below shows the potential-temperature/salinity relationship for the deepest theta levels where the relationship between the two parameters should show the least variation.
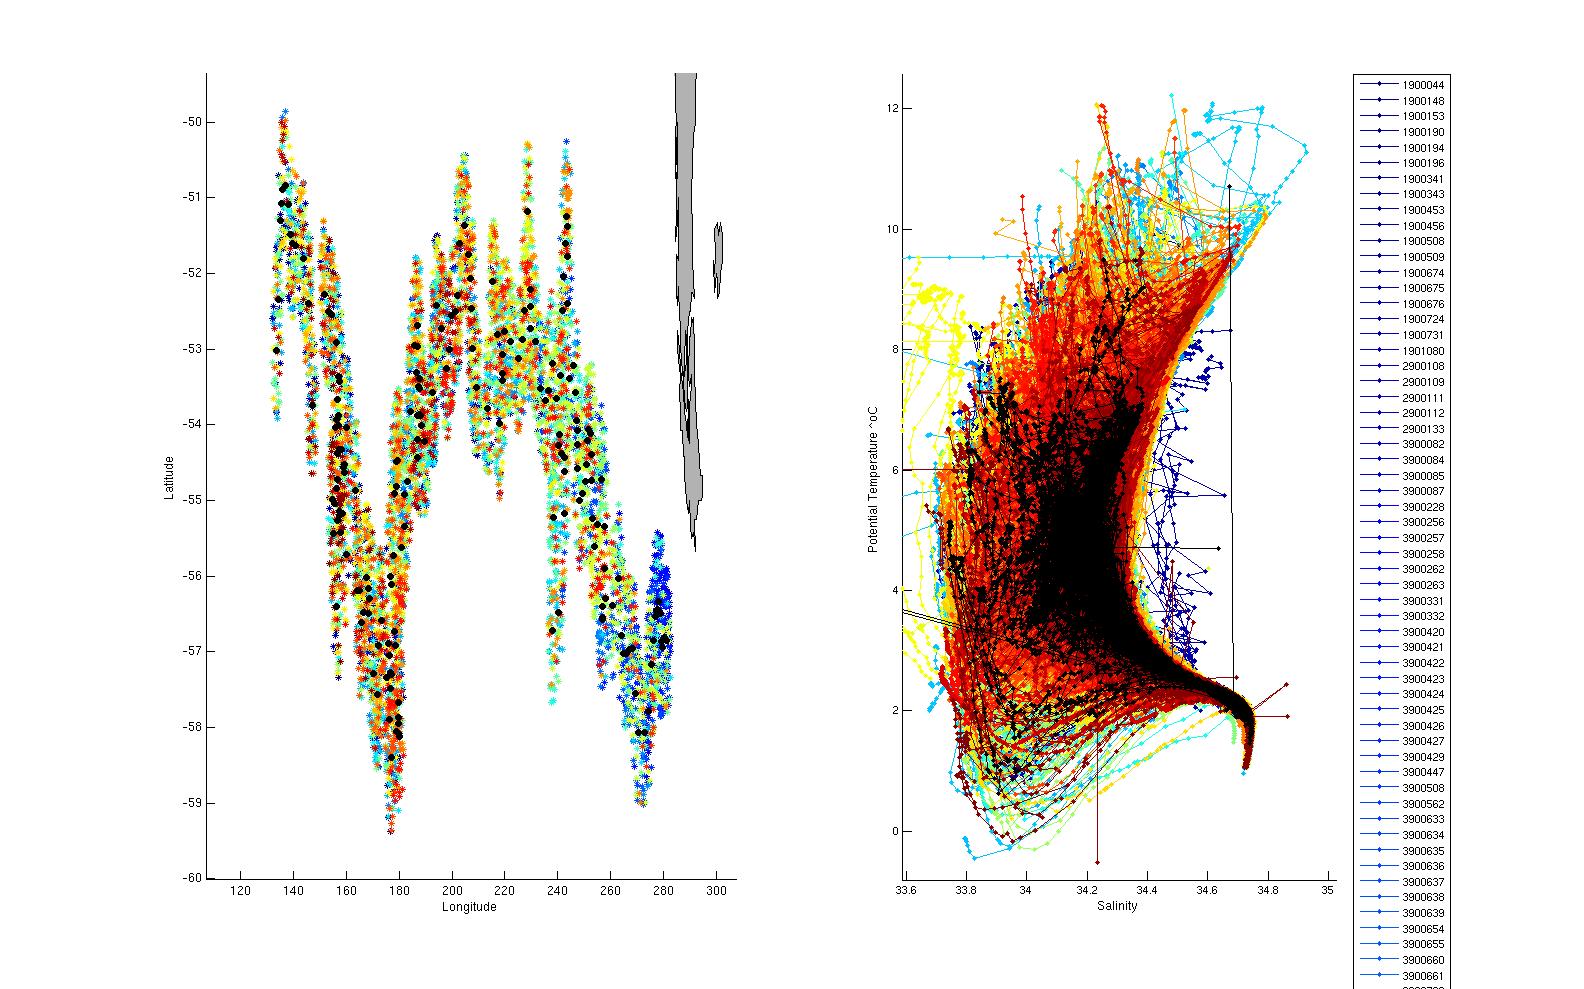
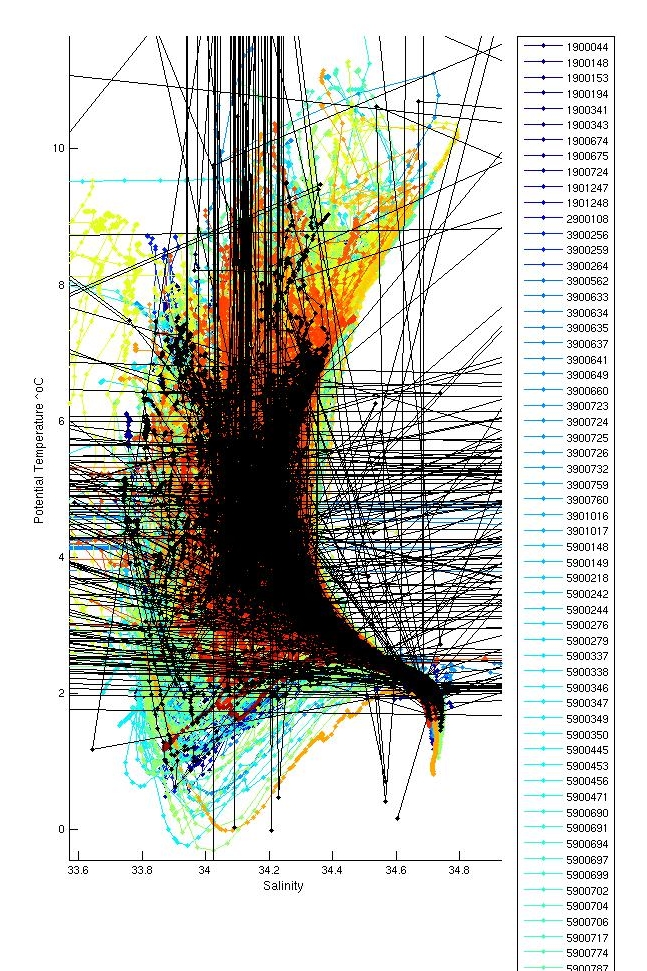
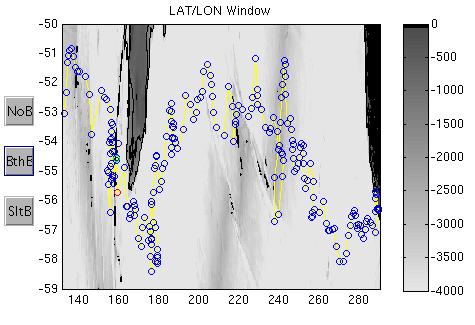
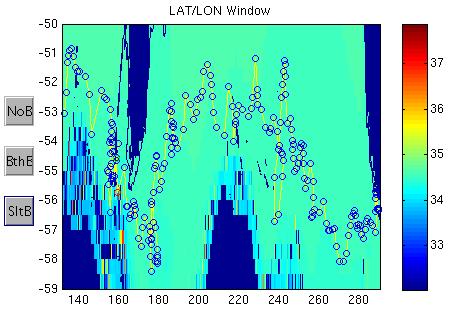
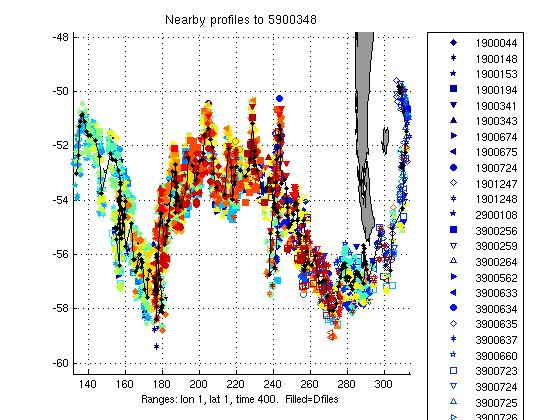
The two plots below show a). the location of this float (black circles) in relation to the position of other nearby argo floats (coloured circles) and b). The potential-temperature/salinity curve for this float (in black) compared to nearby argo floats (coloured).
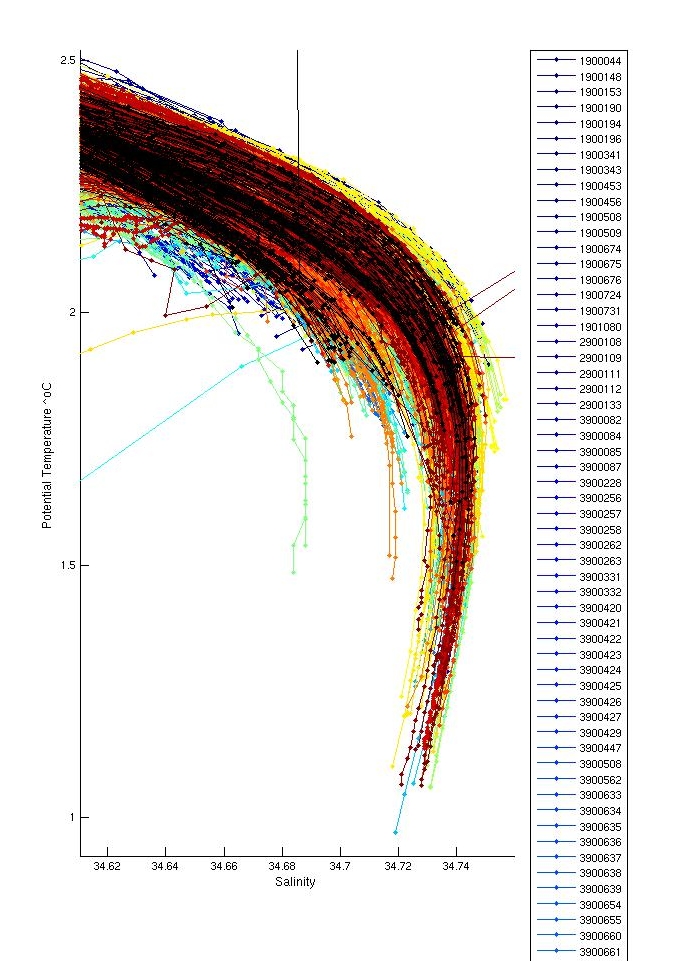
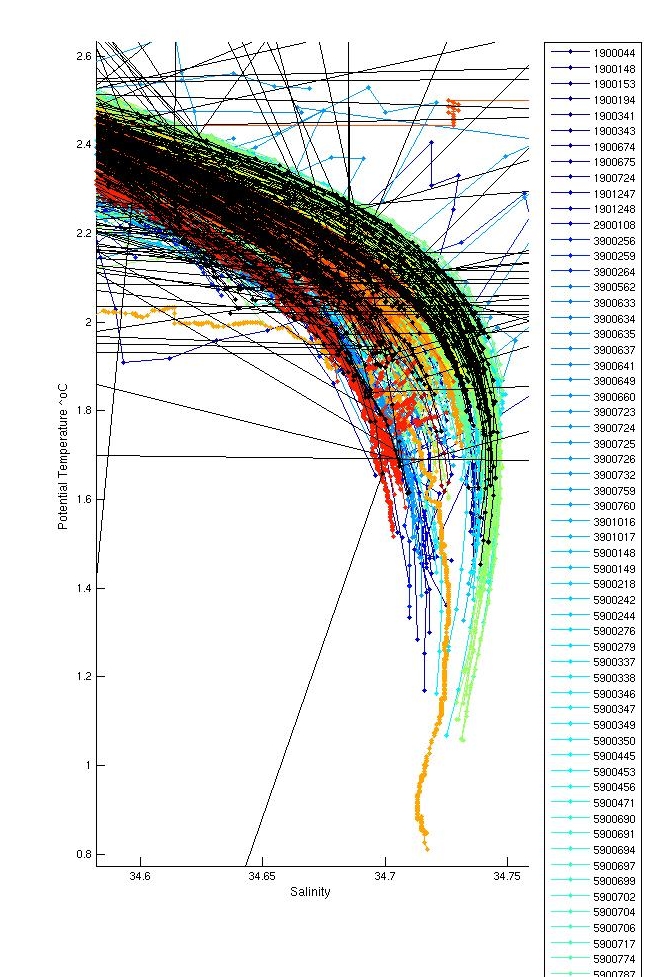
The potential-temperature/salinity relation for the deepest theta levels for this float (in black) and nearby argo floats (coloured) is displayed below.
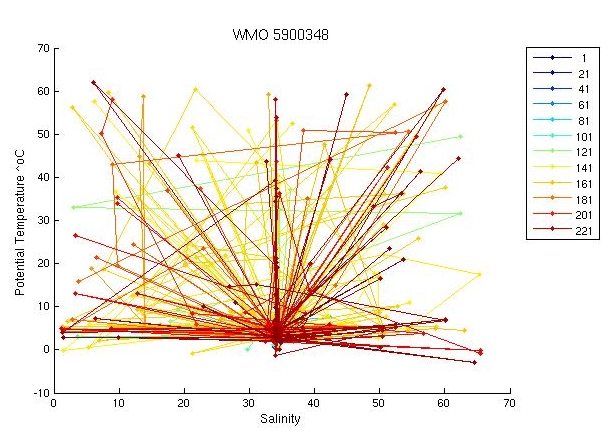
There were inversions in profiles; 22,42,69,73,84,106,112,174. None of these were significant and therefore were not flagged. Inversions in profiles; 55 at 50m and 380m, 103 at 15m, 159 at 1800m were flagged as QC=4. There were multiple inversions in pfs; 185,186,187,188,191,192,194,198,200,204,206,208,209,210,211 caused by bad pressure data. These were all flagged as QC=4.
Salt hooks were located in profiles; 5,7,9,11,13,15,16,18,20,23,24,26,28,30,32,34,36,38,39,42,44,46,48,49,51,53,55,57,60,62,64,66,68,71,75,77,79,81,83,86,88,90,92,94,103,104,106,108,110,112,116,120,121,122,123,125,127,129,131,136,138,140,143,144,146,148,150,152,154,156,158,162,164,167,172,175,180,182,184,186,188,190,193,195,197,199,201,203,205,207,208,212. These were flagged as QC 4 for both T & S.
Flagged two large spikes in temperature in profile 103. Profiles 157 and 160 QC'd as 4 as the TS data in these profiles looked suspicious. Multiple bad data values in pressure were flagged in numerous profiles particularly towards the latter part of the series.
The plot below shows the analysis of salinity drift using the OW software.

The four plots below show the salinity anomalies on theta surfaces compared to (a) the Gouretski and Kolterman climatology, (b) the CARS (CSIRO Atlas of Regional Seas)/WOA (World Ocean Atlas) climatology, (c) the anomalies within the float series itself, (i.e. the salinity anomaly of each profile from the mean profile average for the float and (d) the raw float salinity compared to the CARS and G&K climatological salinity on a deep theta surface.
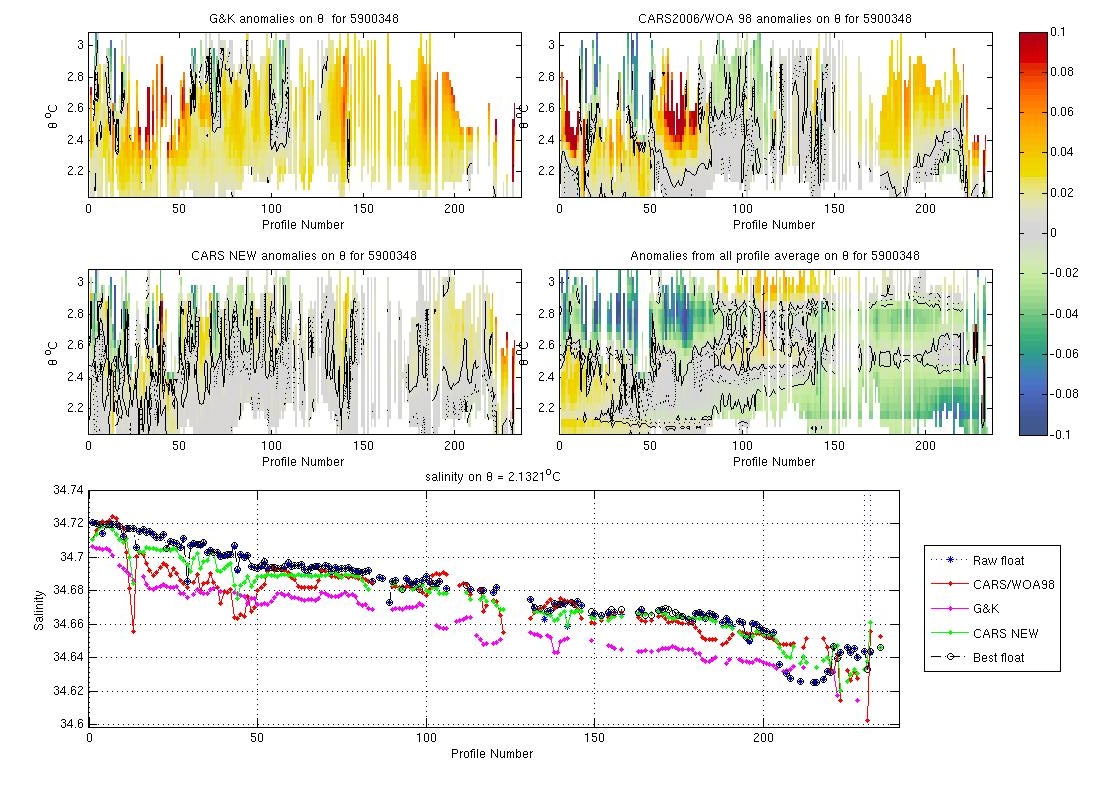
This float is very close to the CARS climatology.
The plots below show the raw float salinity data (solid blue line) compared to neighbouring argo floats (coloured symbols) on a deep potential temperature surface. The locality map shows the location of the profiles for this float and for neighbouring floats.
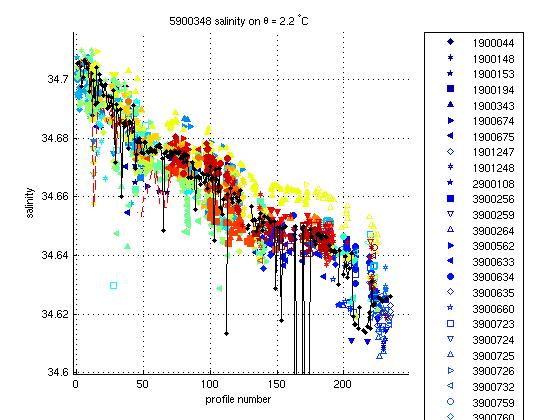
This float is in the middle of the nearby argo envelope.
This float required no salinity drift correction, however note there are multiple bad pressure (and T & S) values that have been QC'd as 4.
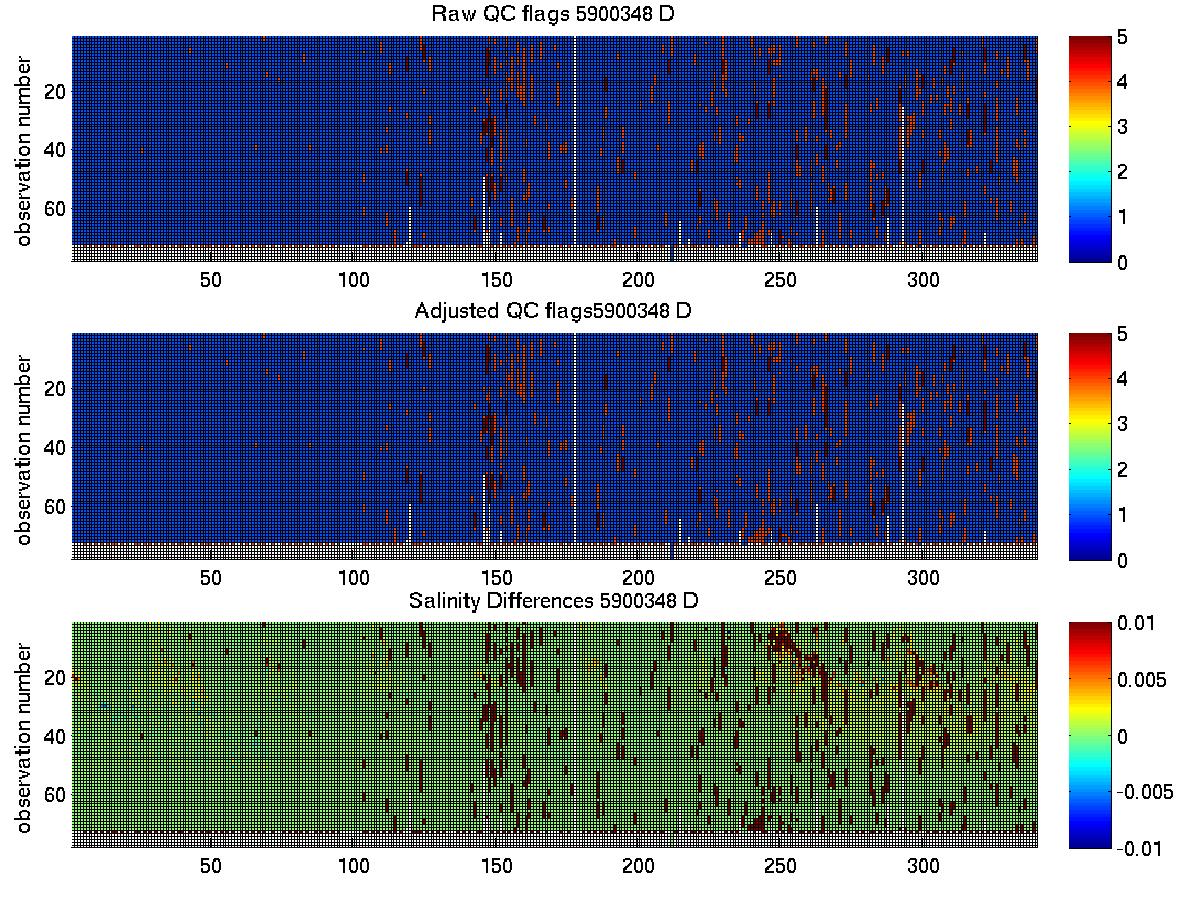
The plot below summarises the QC flags and salinity differences for the raw and adjusted salinity fields in the final delayed mode files submitted to the GDAC.