The table below provides basic information about the float, including primary sensors, mission parameters and current status of profiles.
| Institute | CSIRO |
| Principal Investigator | Susan Wijffels |
| Pressure Sensor | PAINE 3000psia (serial number=2657714160) |
| CTD Sensor | PROVOR-SBE-41 (serial number=187) |
| CTD Sampling Mode | Burst Sampler |
| Controller Board | APF 8 |
| Additional Sensors/Software | None |
| Park Depth | 2000 m |
| Profile Depth | 2000 m |
| Launch Date | 28-11-2002 |
| Number of D-moded Profiles | 54 |
| Calibration Date | 20-09-2010 |
| Pressure Drift | Surface Pressure Offset corrected |
| Salinity Drift | No salinity drift detected but float affected by biofouling for the first 35 profiles, corrected using OW |
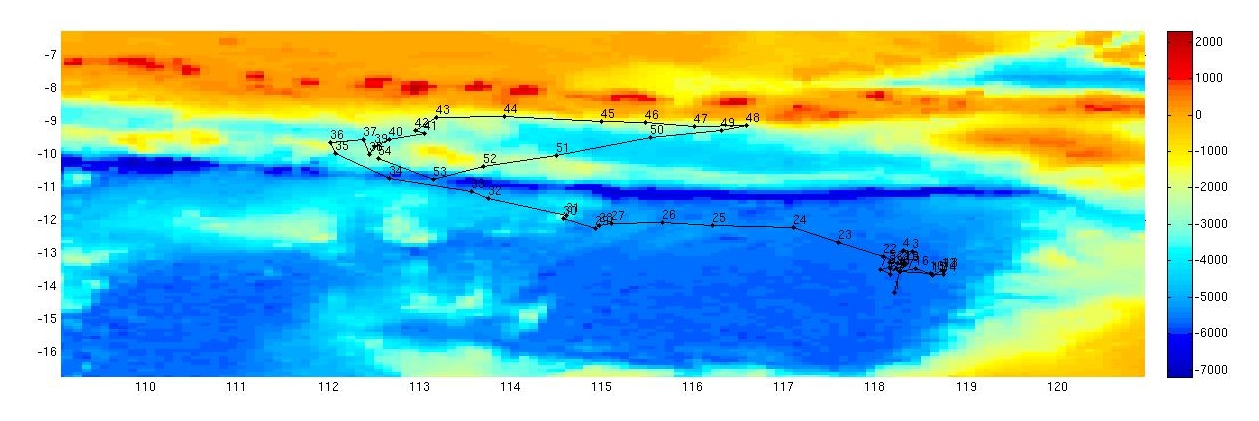
This float was located in the Indonesian Throughflow and was either beached or picked up after 54 profiles. The float drifted in an area bounded by 112 to 119 şE and 8 to 14 ş S.
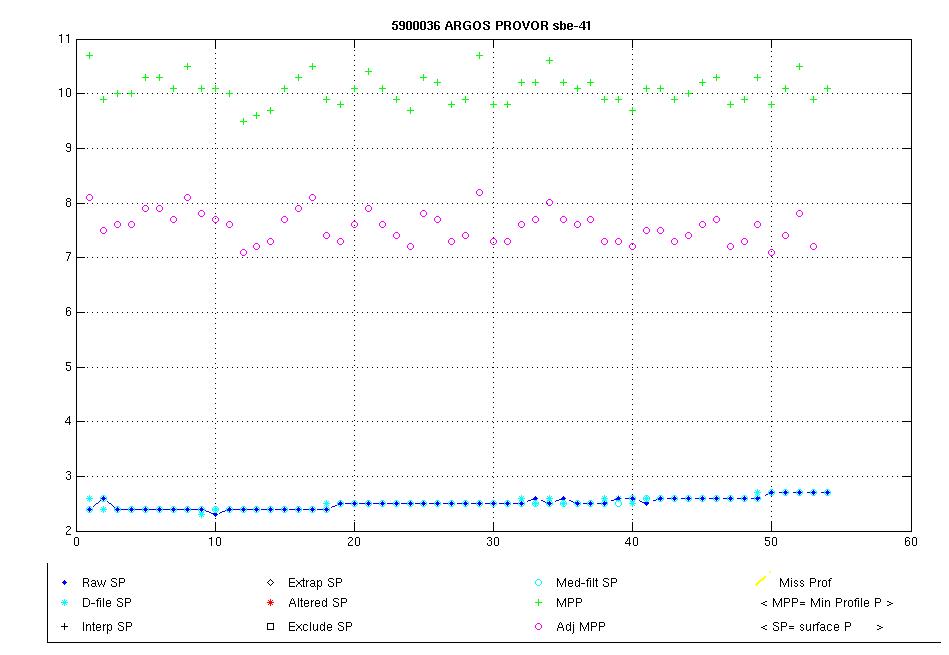
The surface pressure for this float is shown in the plot below.
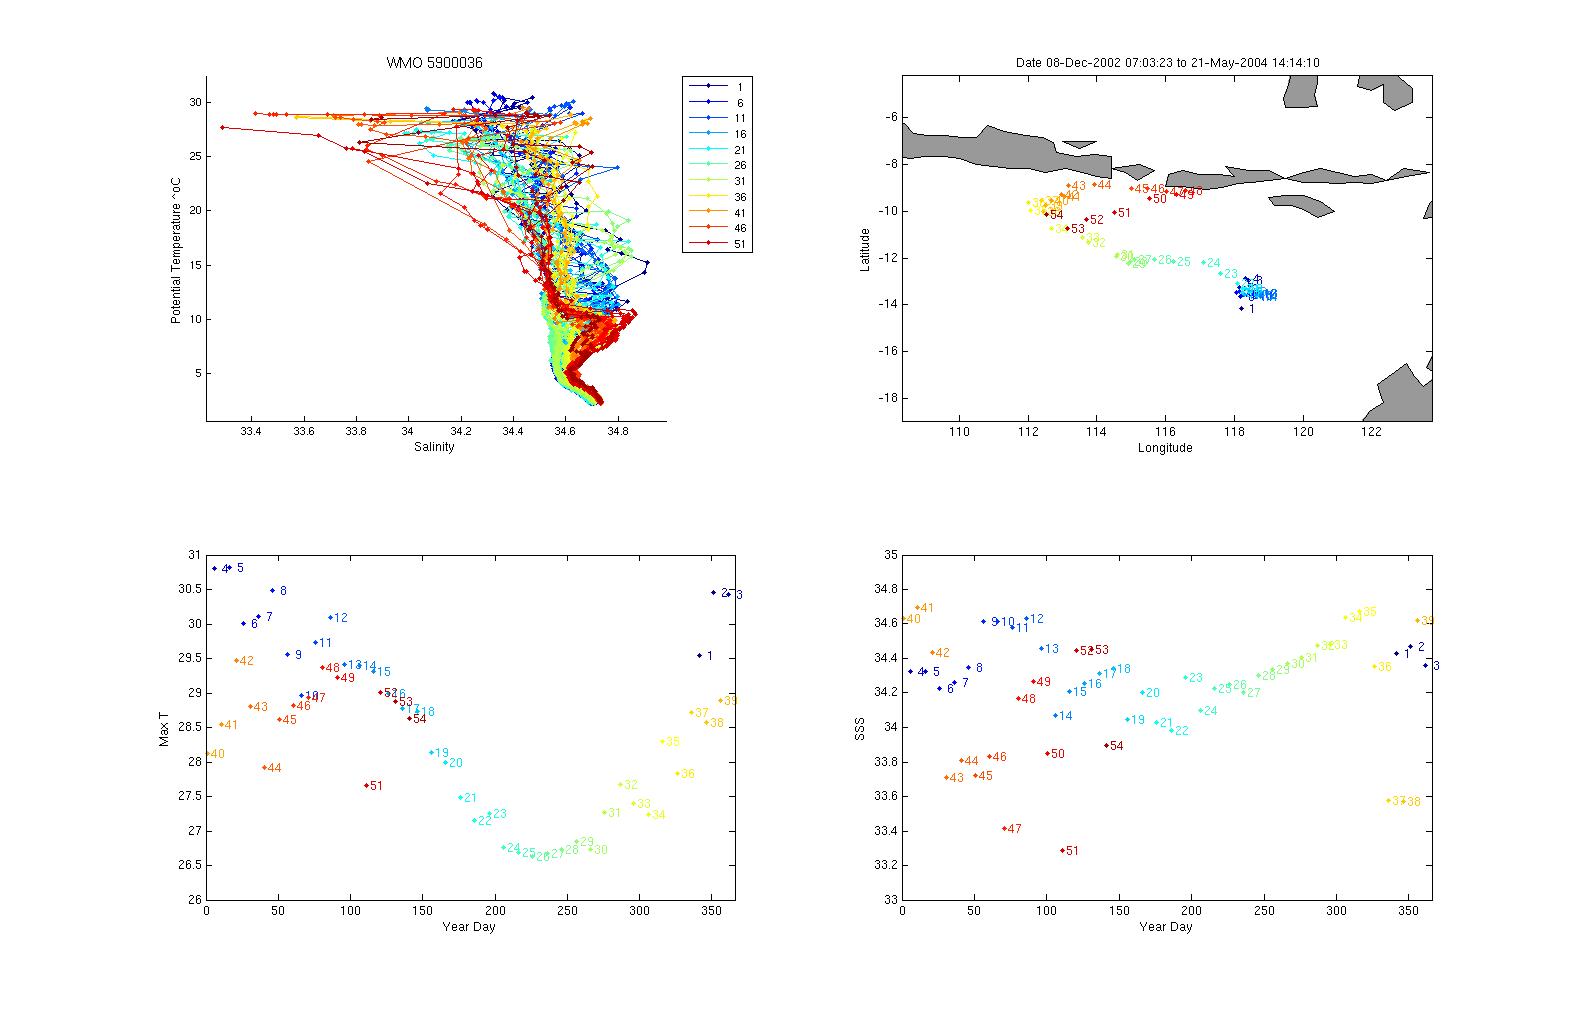
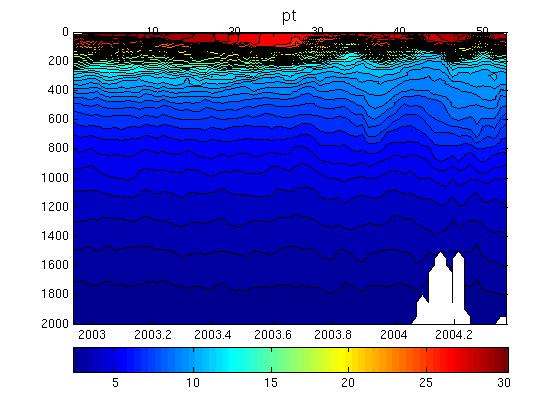
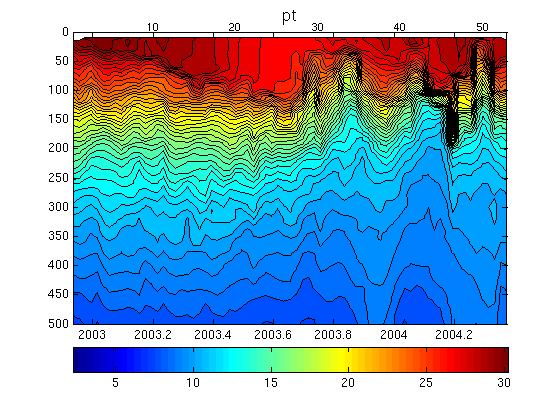
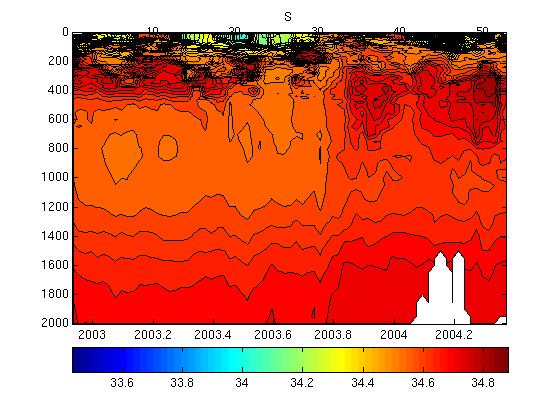
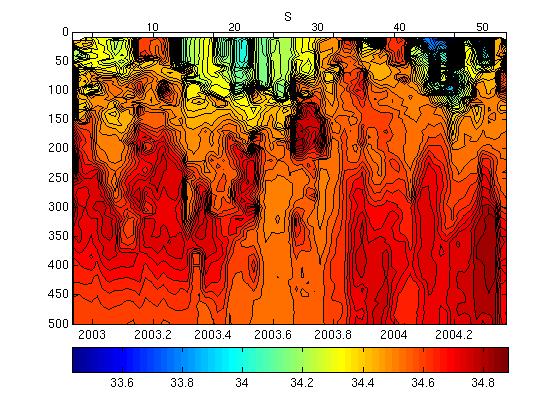
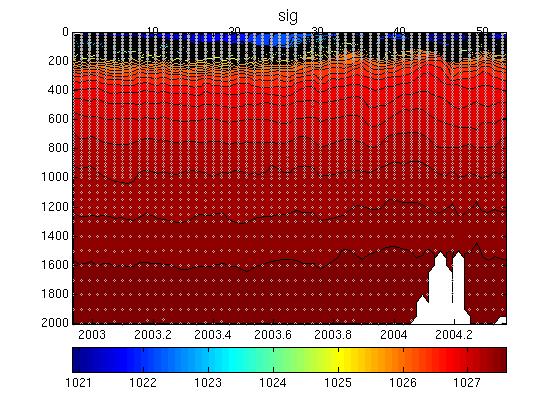
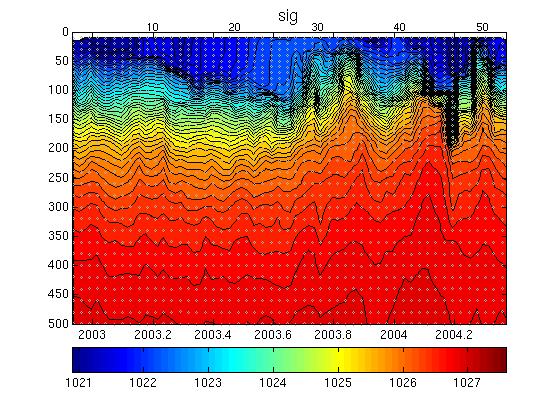
Potential Temperature-Salinity (a), Location (b, Max Temperature (c) and Sea Surface Salinity (d) plots located below.
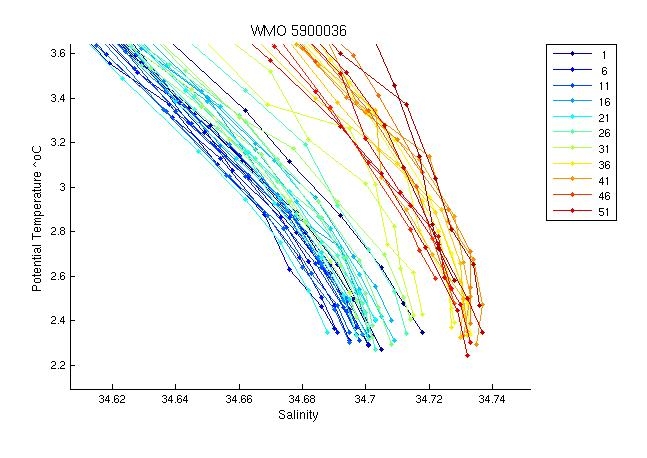
The plot below shows the potential-temperature/salinity relationship for the deepest theta levels where the relationship between the two parameters should show the least variation.
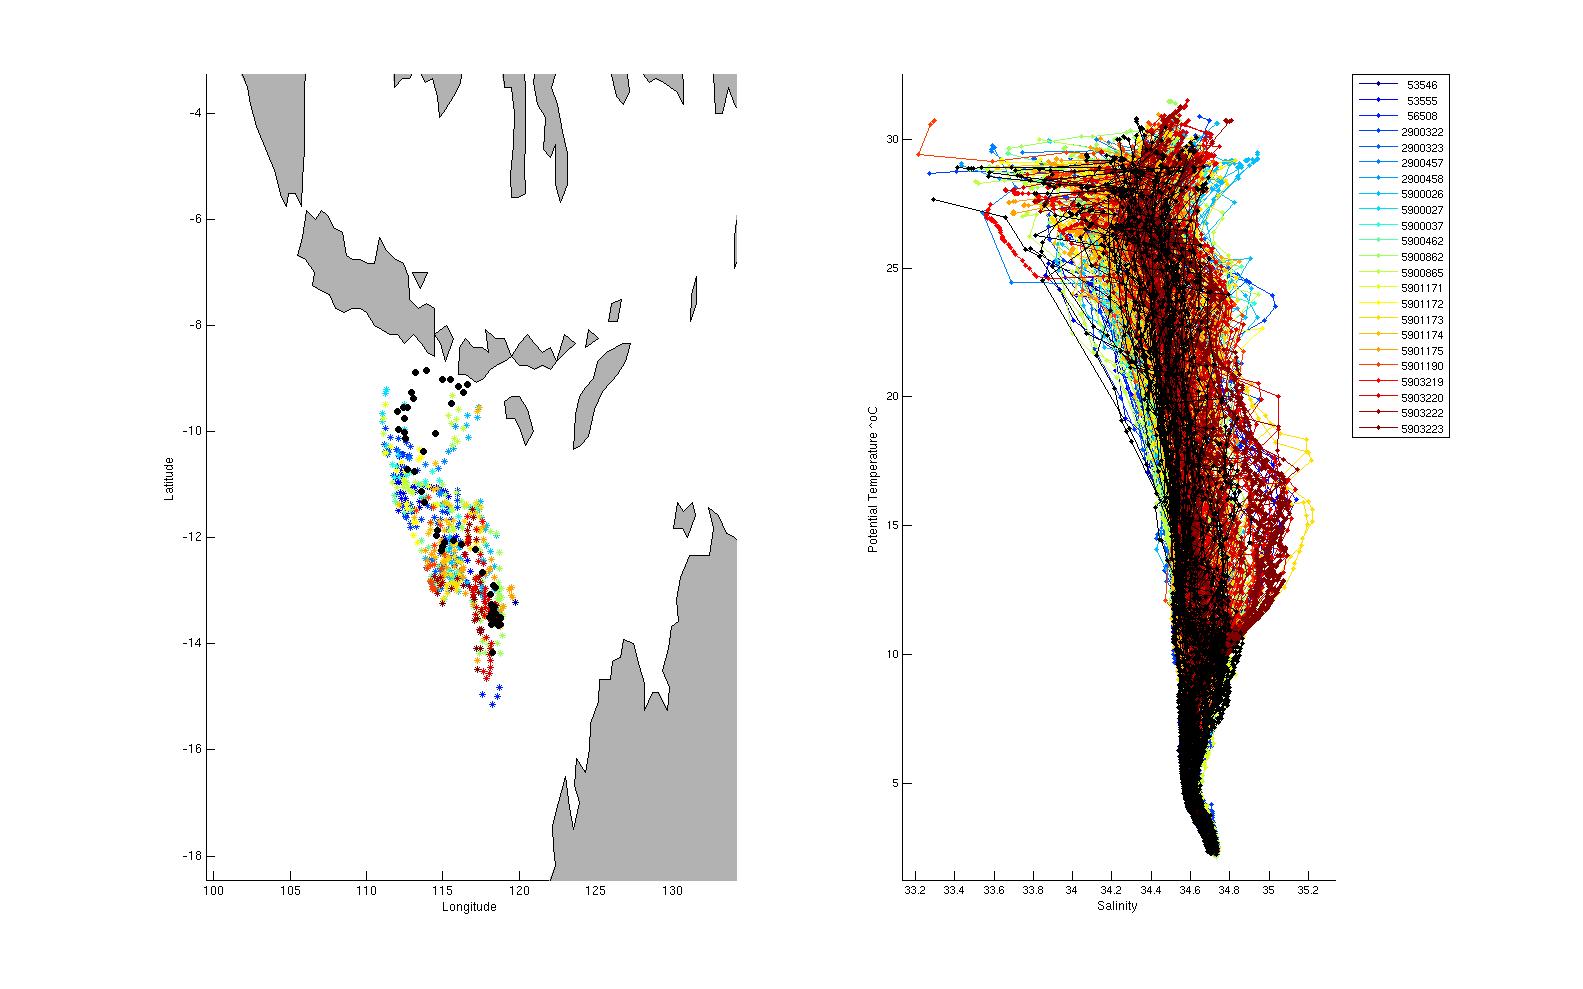
The two plots below show a). the location of this float (black circles) in relation to the position of other nearby argo floats (coloured circles) and b). The potential-temperature/salinity curve for this float (in black) compared to nearby argo floats (coloured).
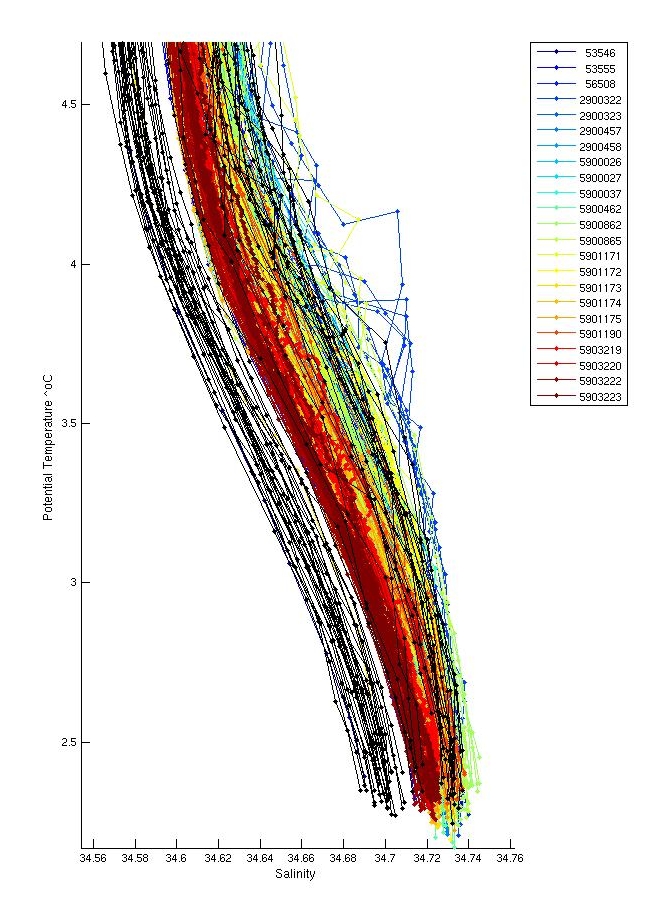
The potential-temperature/salinity relation for the deepest theta levels for this float (in black) and nearby argo floats (coloured) is displayed below.
There were no inversions.
There were no salt hooks.
A large fresh spike in profile 46 at 100 m was flagged as QC=4 but all else was fine.
The plot below shows the analysis of salinity drift using the OW software.

The four plots below show the salinity anomalies on theta surfaces compared to (a) the Gouretski and Kolterman climatology, (b) the CARS (CSIRO Atlas of Regional Seas)/WOA (World Ocean Atlas) climatology, (c) the anomalies within the float series itself, (i.e. the salinity anomaly of each profile from the mean profile average for the float and (d) the raw float salinity compared to the CARS and G&K climatological salinity on a deep theta surface.
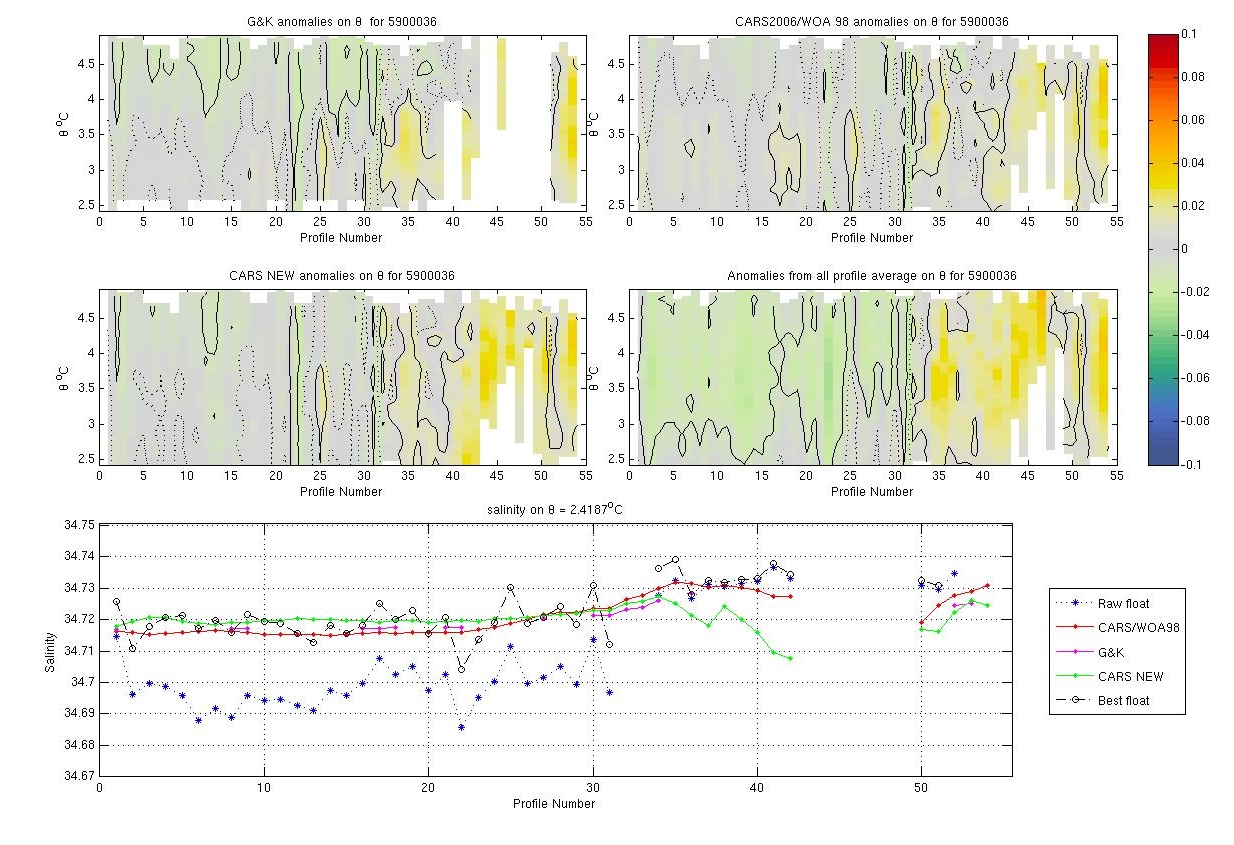
This float appears to have a fresh offset from pf 2 to 35 (of 0.01-0.02) compared to climatologies.
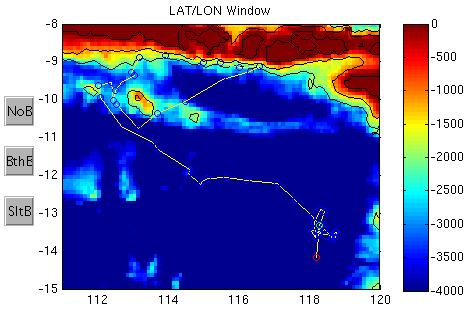
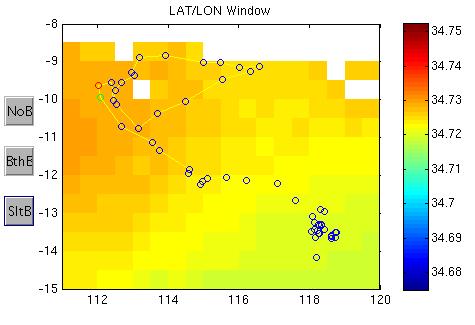
The plots below show the raw float salinity data (solid blue line) compared to neighbouring argo floats (coloured symbols) on a deep potential temperature surface. The locality map shows the location of the profiles for this float and for neighbouring floats.
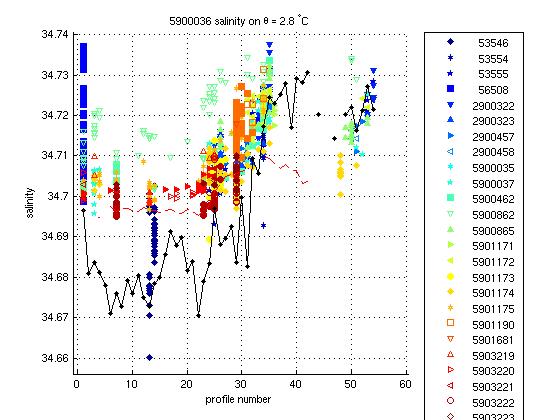
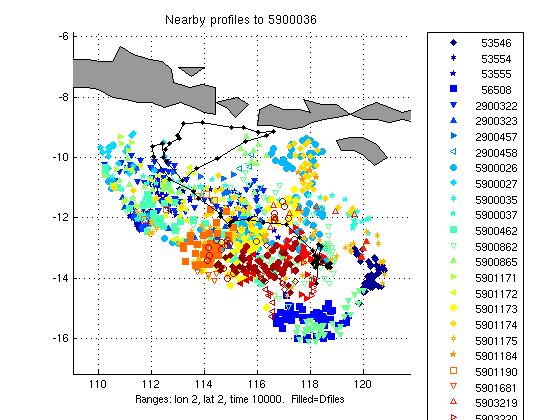
Nearby argo shows that this float started off in calibration for the first profiles, was then affected by a fresh offset (most likely biofouling) and came back into calibration around pf 36.
This float probably suffered from long term biofouling from profiles 2 to 35, these profiles corrected using OW, otherwise no salinity drift.
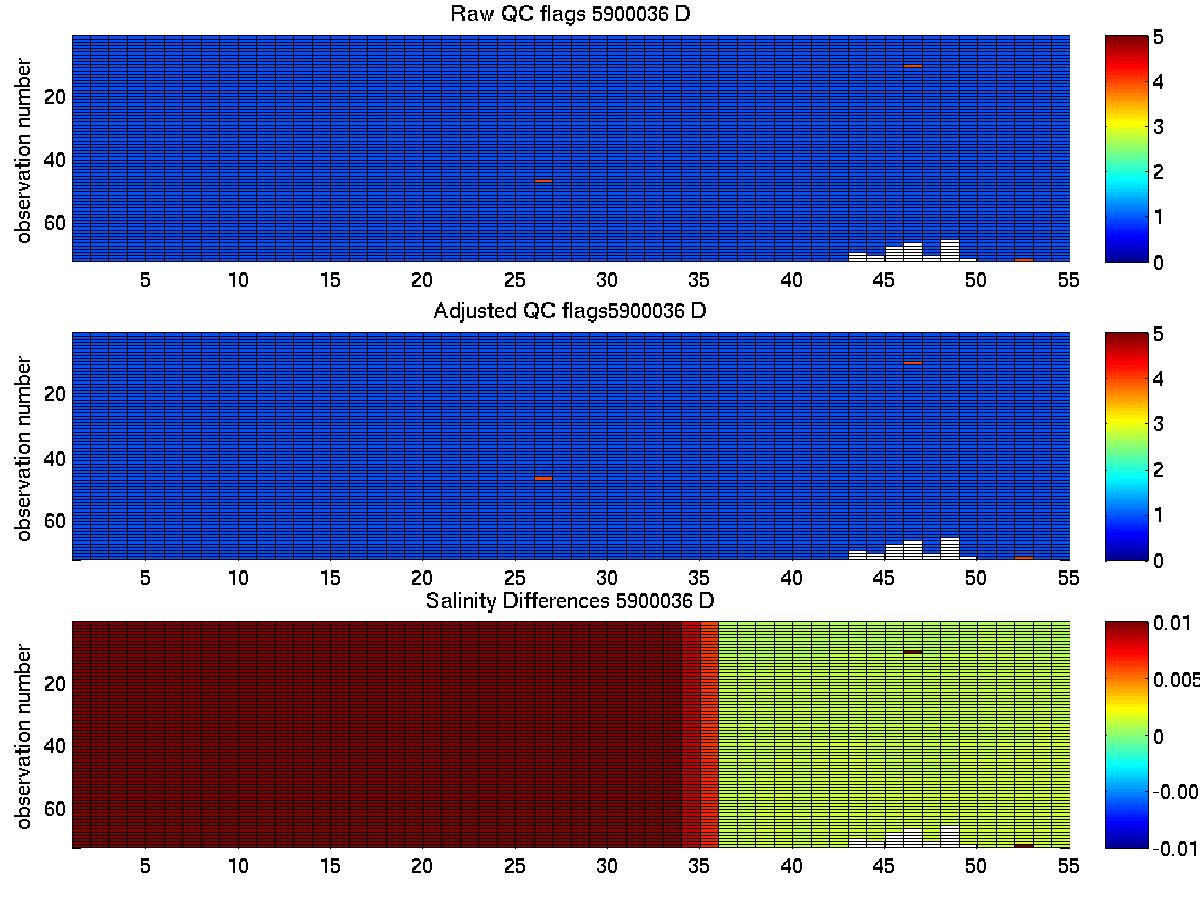
The plot below summarises the QC flags and salinity differences for the raw and adjusted salinity fields in the final delayed mode files submitted to the GDAC.
Created 20-09-2010