The table below provides basic information about the float, including primary sensors, mission parameters and current status of profiles.
| Institute | CSIRO |
| Principal Investigator | Susan Wijffels |
| Pressure Sensor | PAINE 3000psia (serial number=2657718125) |
| CTD Sensor | APEX-SBE-41 (serial number=623) |
| CTD Sampling Mode | Burst Sampler |
| Controller Board | APF 8 |
| Additional Sensors/Software | None |
| Park Depth | 2000 m |
| Profile Depth | 2000 m |
| Launch Date | 26-09-2002 |
| Number of D-moded Profiles | 336 |
| Calibration Date | 14-06-2012 |
| Pressure Drift | Surface Pressure Offset corrected |
| Salinity Drift | No salinity drift detected |
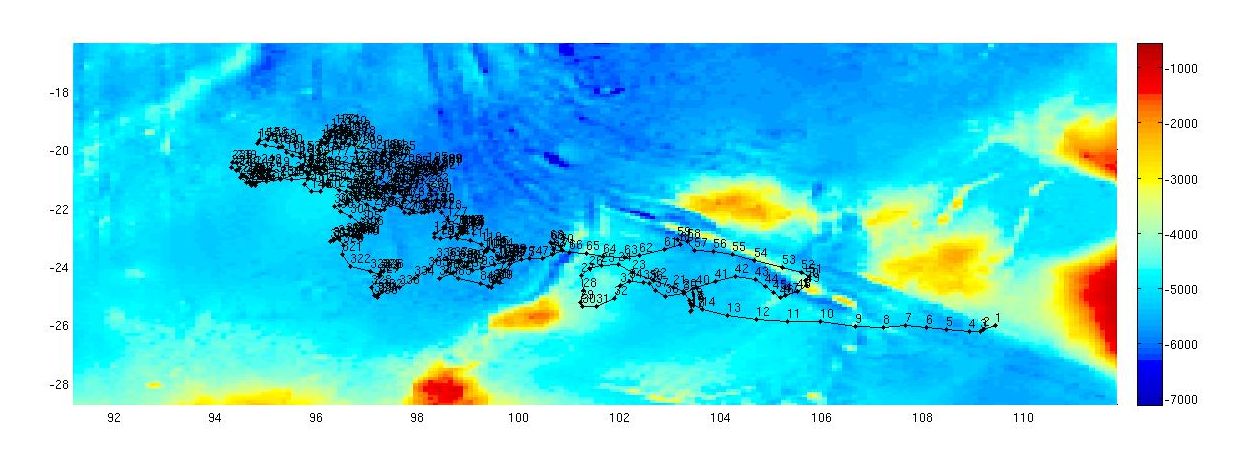
This float was located in the Indian Ocean, in an area bounded by 94 to 110 şE and 18 to 26 ş S.
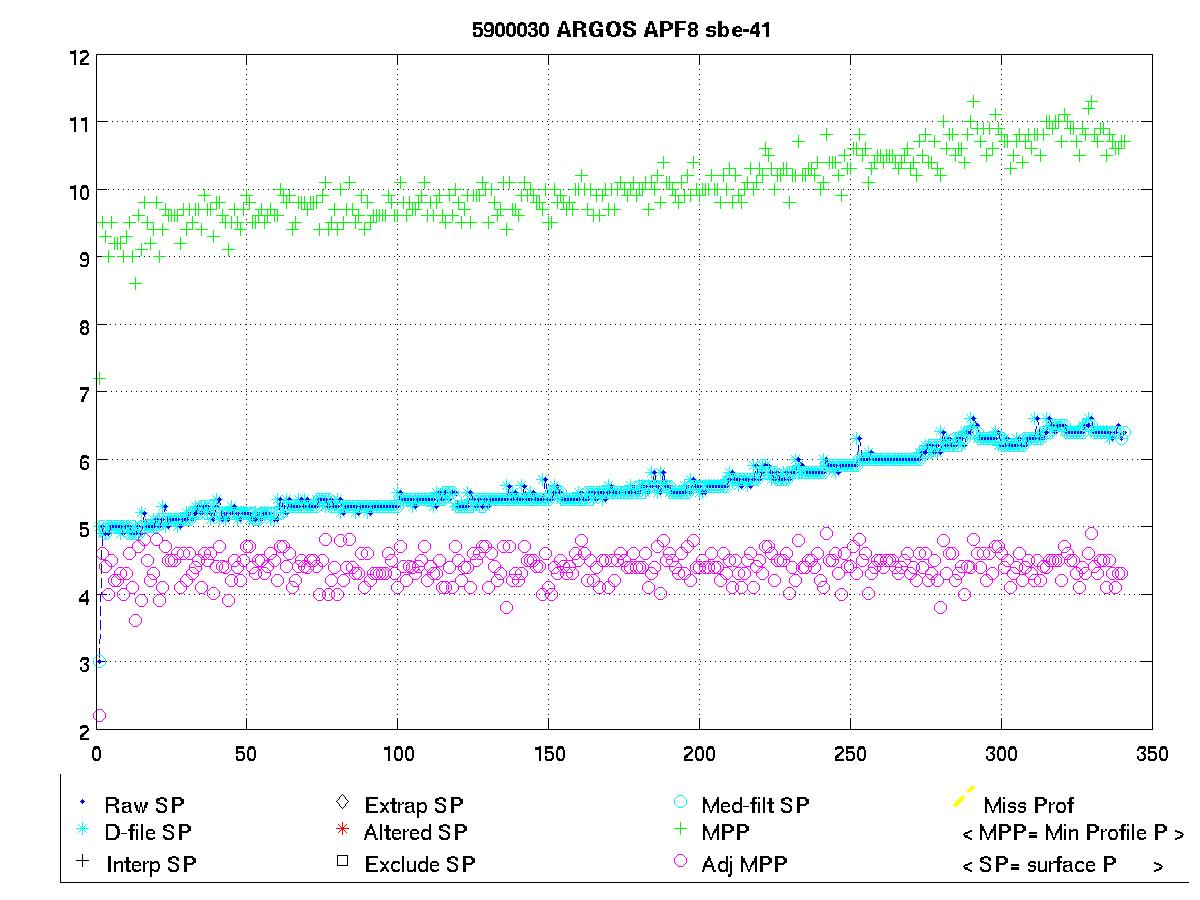
The surface pressure for this float is shown in the plot below.
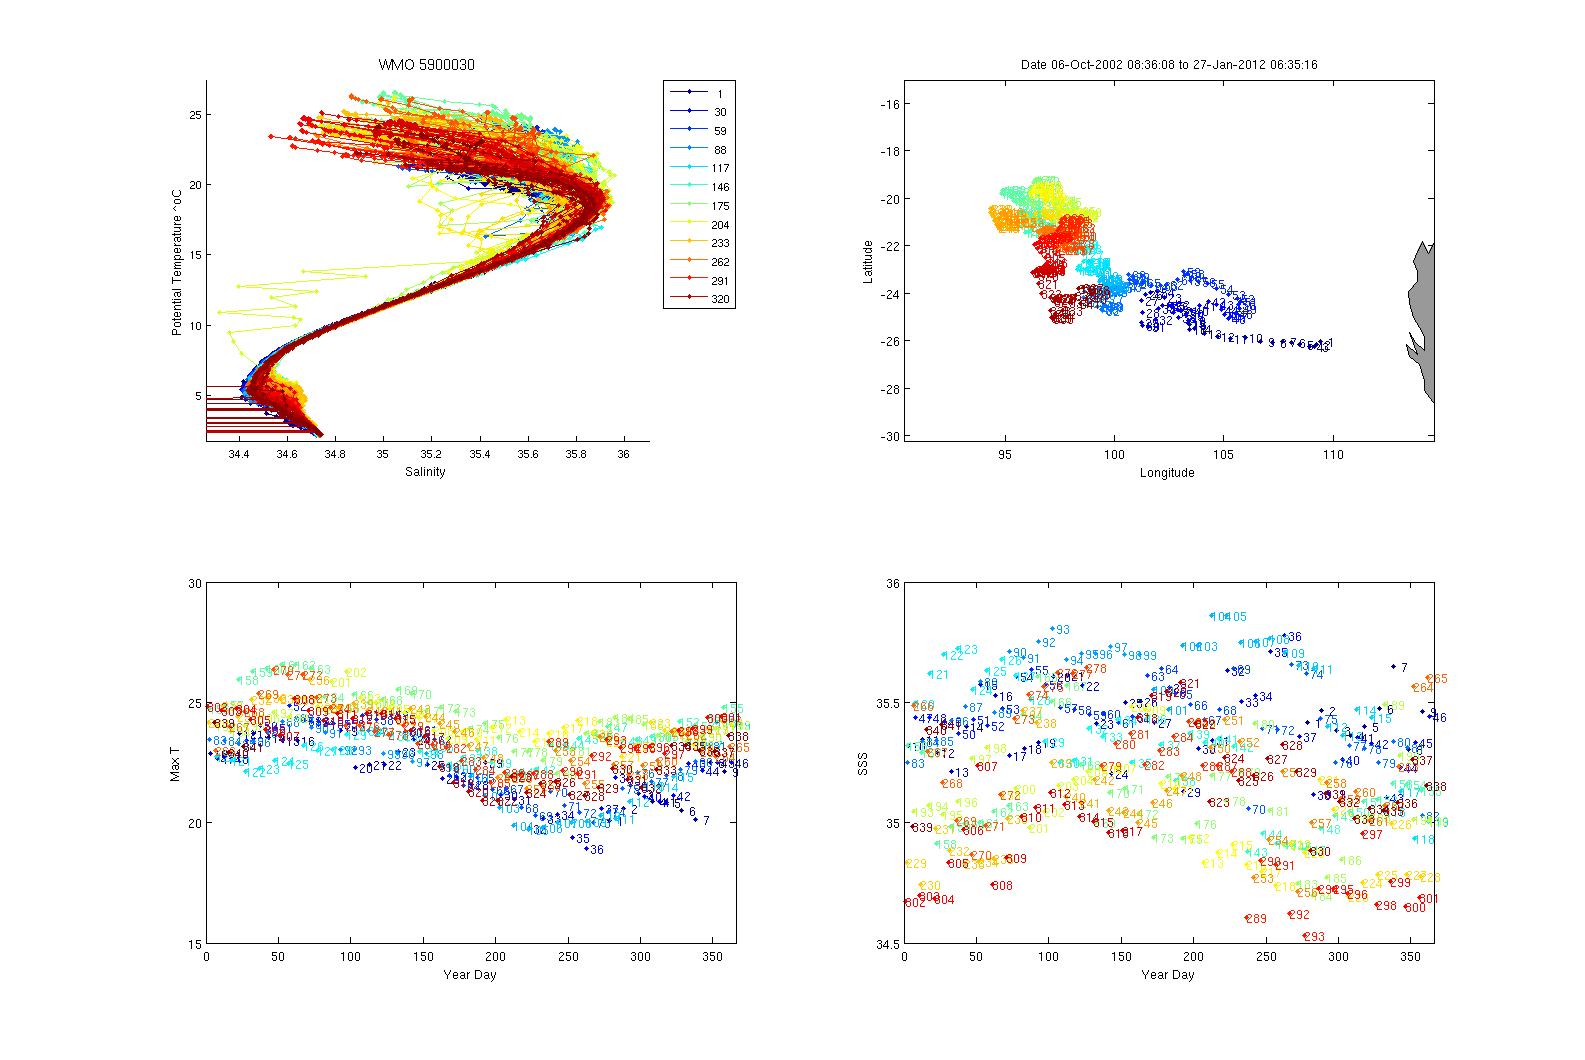
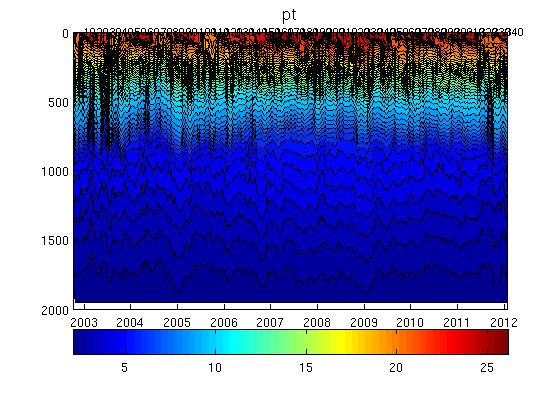
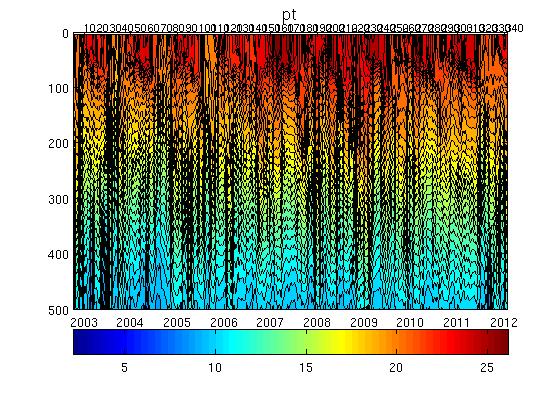
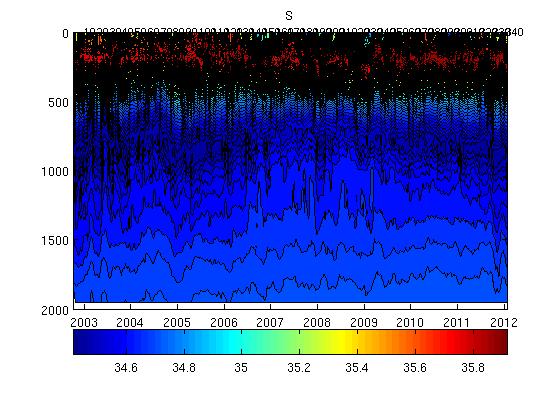
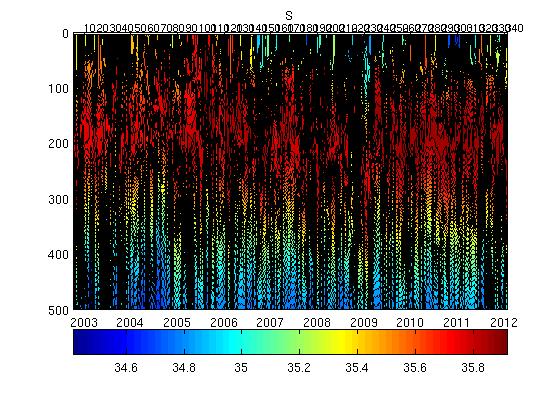
Potential Temperature-Salinity (a), Location (b, Max Temperature (c) and Sea Surface Salinity (d) plots located below.
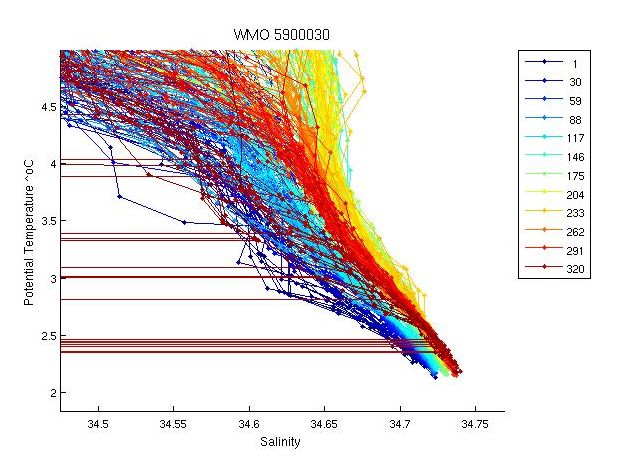
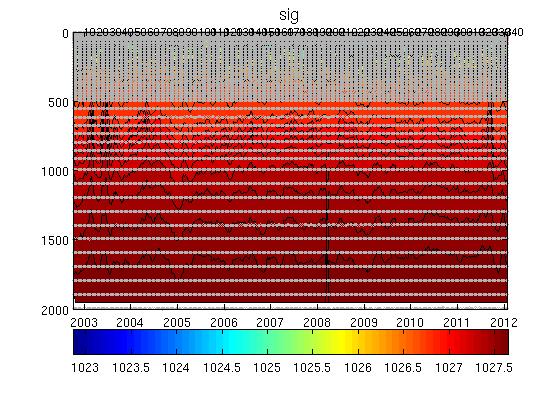
The plot below shows the potential-temperature/salinity relationship for the deepest theta levels where the relationship between the two parameters should show the least variation.
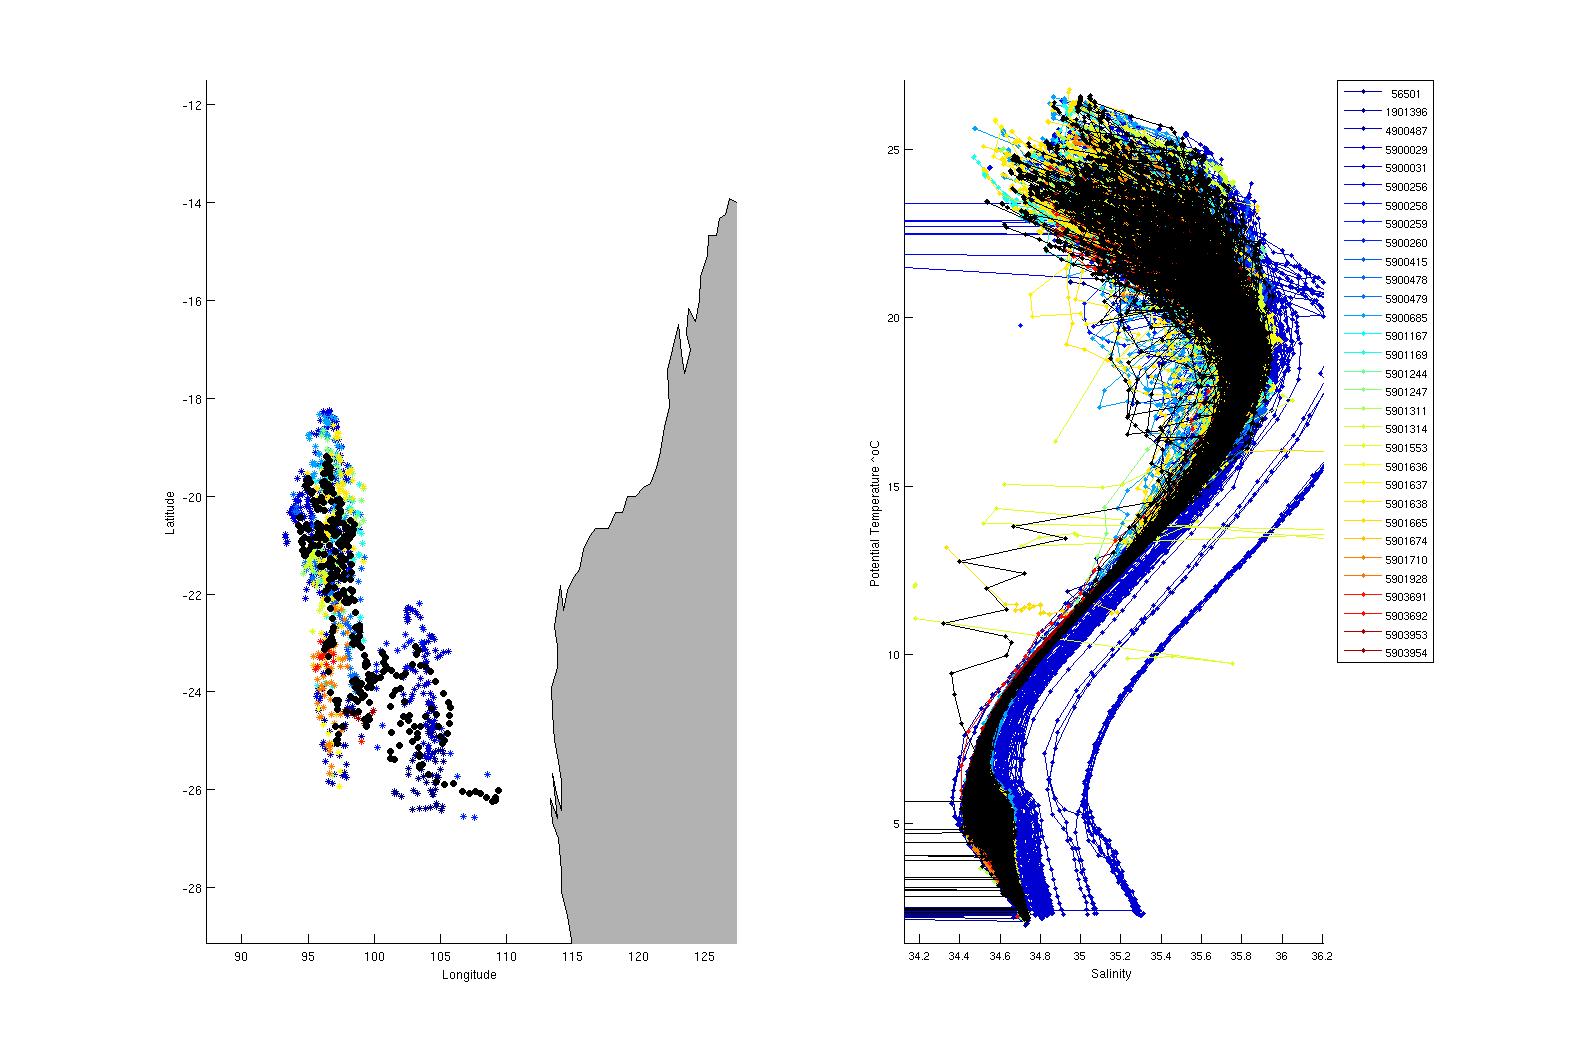
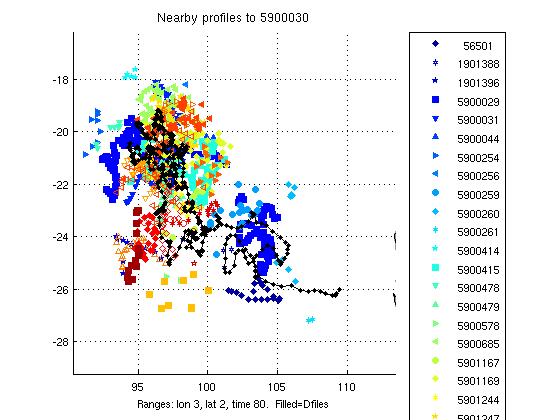
The two plots below show a). the location of this float (black circles) in relation to the position of other nearby argo floats (coloured circles) and b). The potential-temperature/salinity curve for this float (in black) compared to nearby argo floats (coloured).
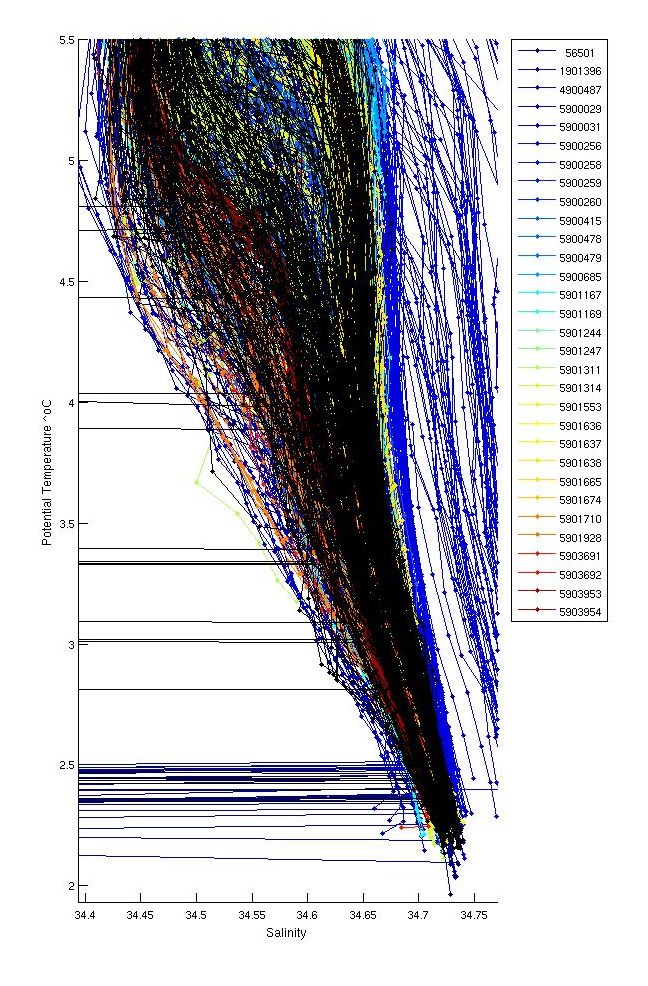
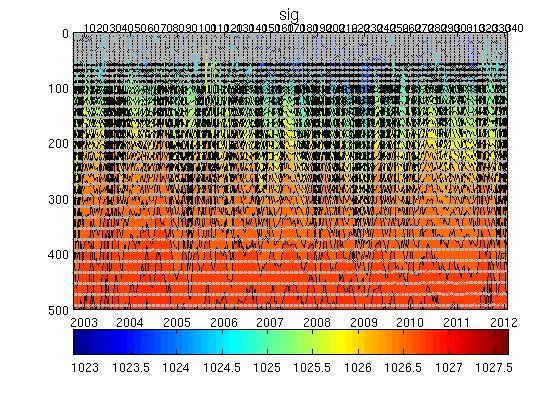
The potential-temperature/salinity relation for the deepest theta levels for this float (in black) and nearby argo floats (coloured) is displayed below.
There were inversions in profiles; 106,125,128. None of these were significant and therefore were not flagged. Some inversions were found in salinity pf 200 between 300 and 500 db caused by bad data and were flagged as QC=4.
Salt hooks were located in profiles; 1,2,3,4,5,6,7,9,11,12,13,14,15,16,17,18,19,20,21,22,23,24,25,26,27,28,30,31,32,33,34,35,36,37,38,39,40,41,42,43,44,45,46,47,48,49,50,51,52,53,54,55,57,58,59,61,62,63,65,66,67,68,69,70,71,72,73,74,75, 76,77,78,79,80,82,83,84,85,87,88,89,90,92,93,94,95,96,97,98,99,100,101,102,104,105,107,108,109,110,111,113,114,115,116,117,118,119,120,121,122,123,124,125,126,127,131,132, 133,134,135,137,139,140,141,142,143,144,145,146,147. These were flagged as QC 4 for both T & S.
The bottom values of pfs 317:320 were flagged as QC=4, deep salinity spikes in profiles; 327,330,331,332,334 and 335 were flagged as QC=4.
The plot below shows the analysis of salinity drift using the OW software.

The four plots below show the salinity anomalies on theta surfaces compared to (a) the Gouretski and Kolterman climatology, (b) the CARS (CSIRO Atlas of Regional Seas)/WOA (World Ocean Atlas) climatology, (c) the anomalies within the float series itself, (i.e. the salinity anomaly of each profile from the mean profile average for the float and (d) the raw float salinity compared to the CARS and G&K climatological salinity on a deep theta surface.
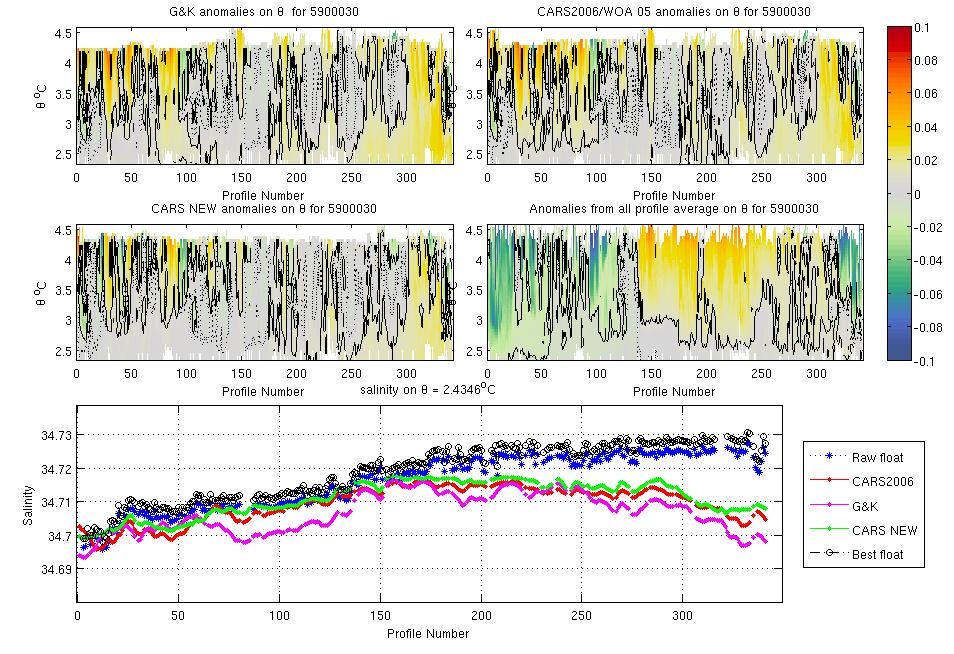
This float could be seen as being salt offset but nearby argo shows that while the float is at the upper end of the nearby argo envelope, at the end of the record it is very close to nearby floats. There are no known patholgies that would cause a salt offset float to come back into calibration, hence this is probably real.
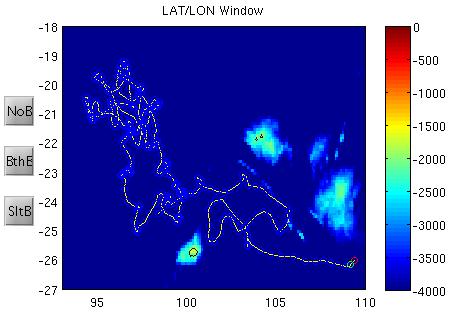
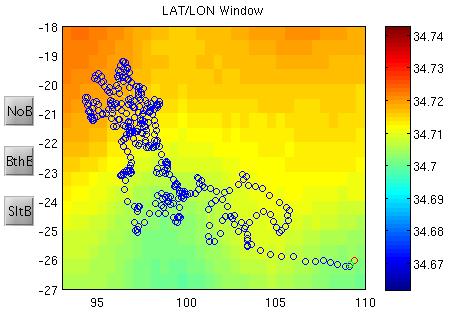
The plots below show the raw float salinity data (solid blue line) compared to neighbouring argo floats (coloured symbols) on a deep potential temperature surface. The locality map shows the location of the profiles for this float and for neighbouring floats.
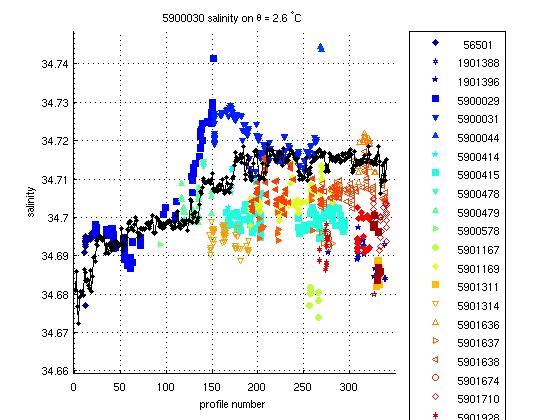
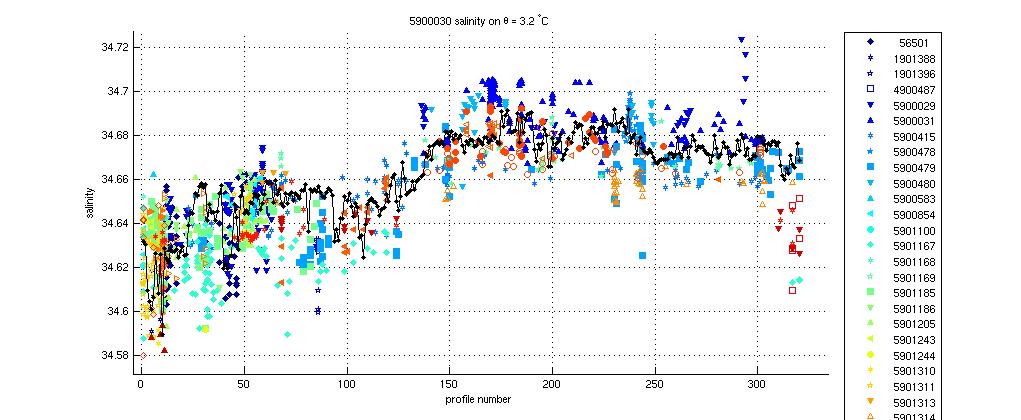
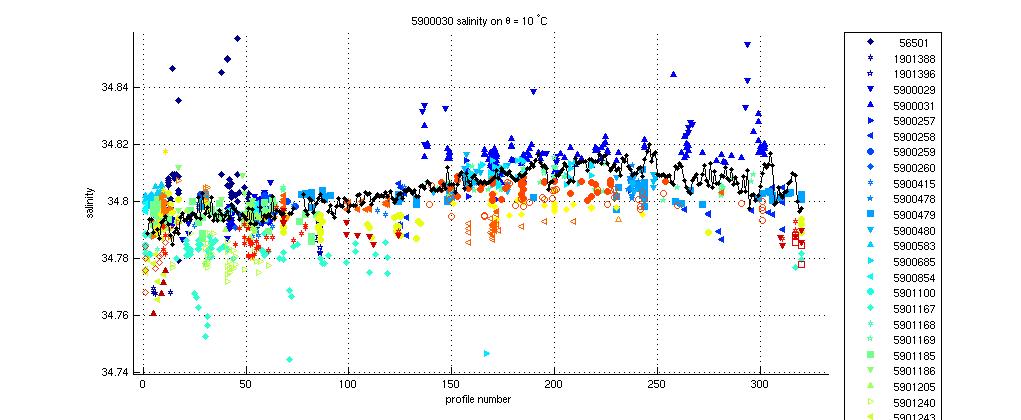
Comparison with nearby argo data confirms that there is indeed no drift in float salinity. The first plot appears to show the float at the upper end of the spectrum but when you compare the float data within a one year time frame there is much closer correspondence both in deep waters and in mode waters.
This float required no salinity drift correction.
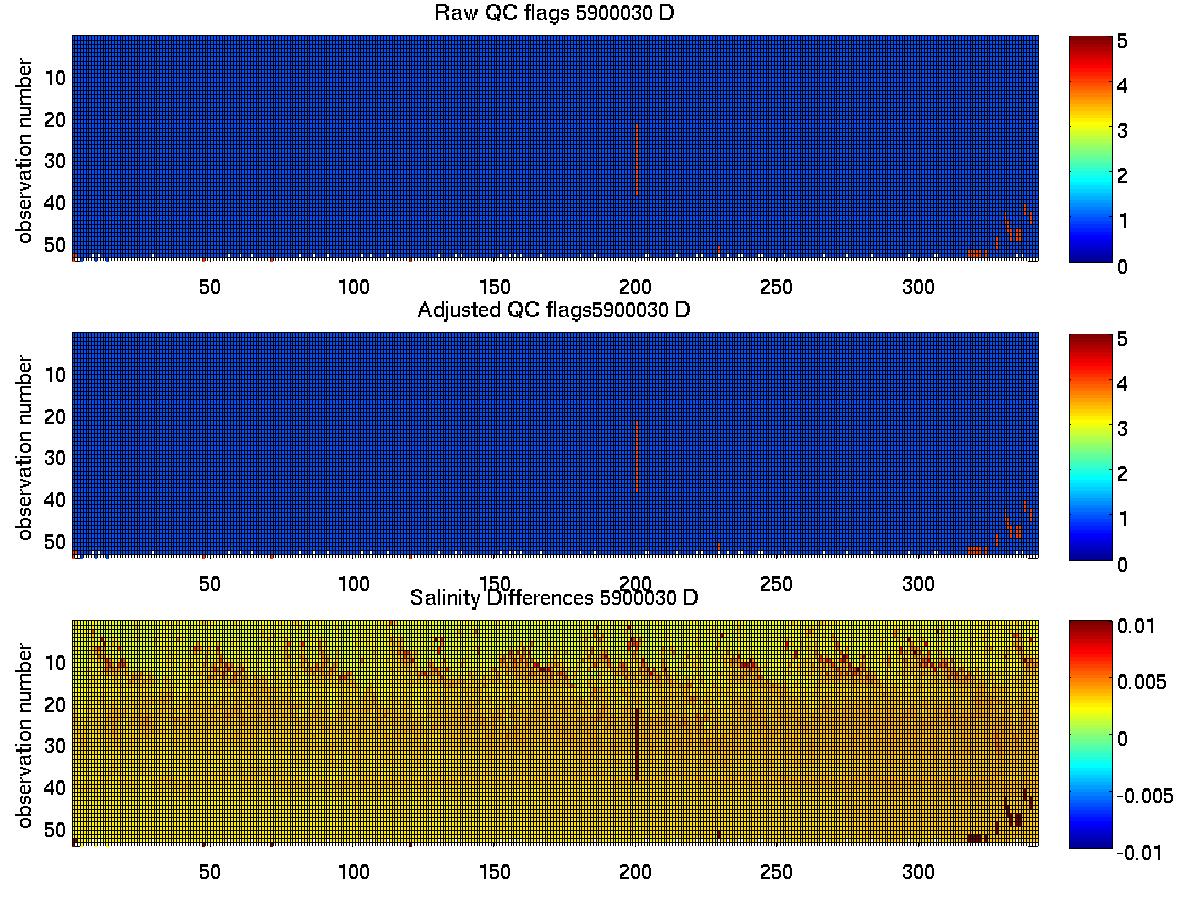
The plot below summarises the QC flags and salinity differences for the raw and adjusted salinity fields in the final delayed mode files submitted to the GDAC.
Created 14-06-2012