The table below provides basic information about the float, including primary sensors, mission parameters and current status of profiles.
| Institute | CSIRO |
| Principal Investigator | Susan Wijffels |
| Pressure Sensor | PAINE 3000psia (serial number=2657718148) |
| CTD Sensor | APEX-SBE-41 (serial number=634) |
| CTD Sampling Mode | Burst Sampler |
| Controller Board | APF 8 |
| Additional Sensors/Software | None |
| Park Depth | 1650 m |
| Profile Depth | 1650 m |
| Launch Date | 18-09-2002 |
| Number of D-moded Profiles | 268 |
| Calibration Date | 26-07-2010 |
| Pressure Drift | Surface Pressure Offset corrected |
| Salinity Drift | No salinity drift profiles 1 to 80, salinity drift detected profiles 81 to 160 corrected with OW, profiles 161 onwards QC'd as 4. |
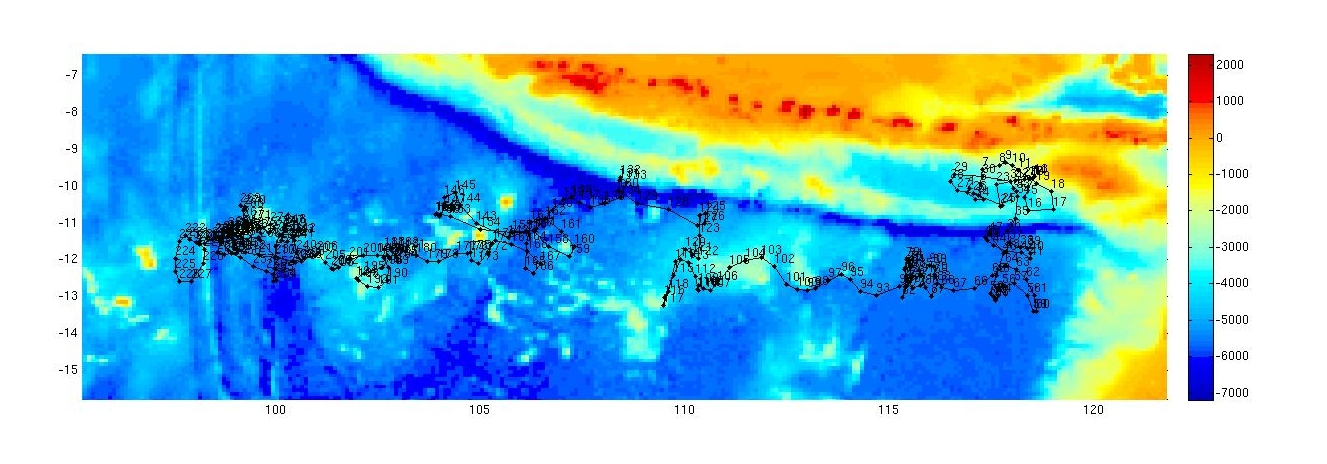
This float was located in the Indonesian throughflow in an area bounded by 97 to 119 şE and 9 to 14 ş S and headed in an overall easterly direction.
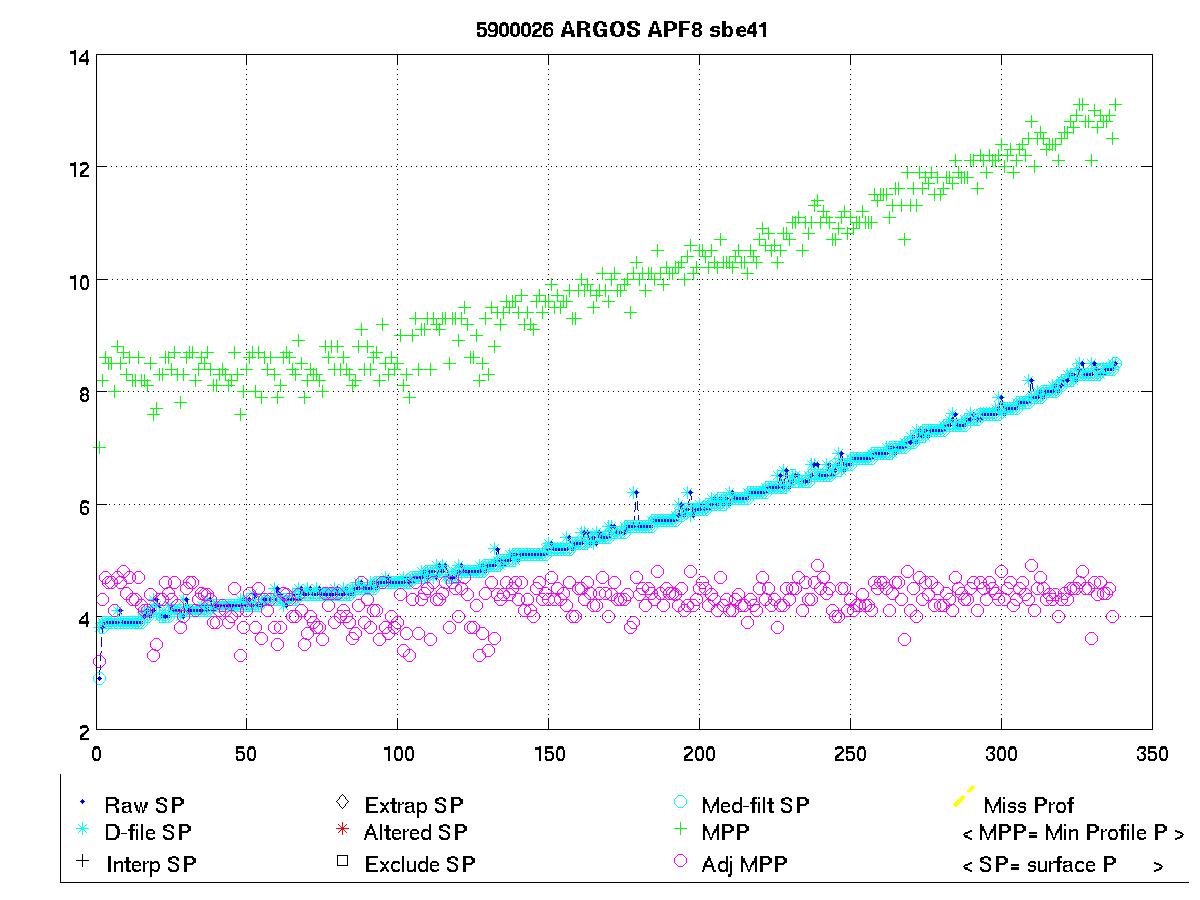
The surface pressure for this float is shown in the plot below.
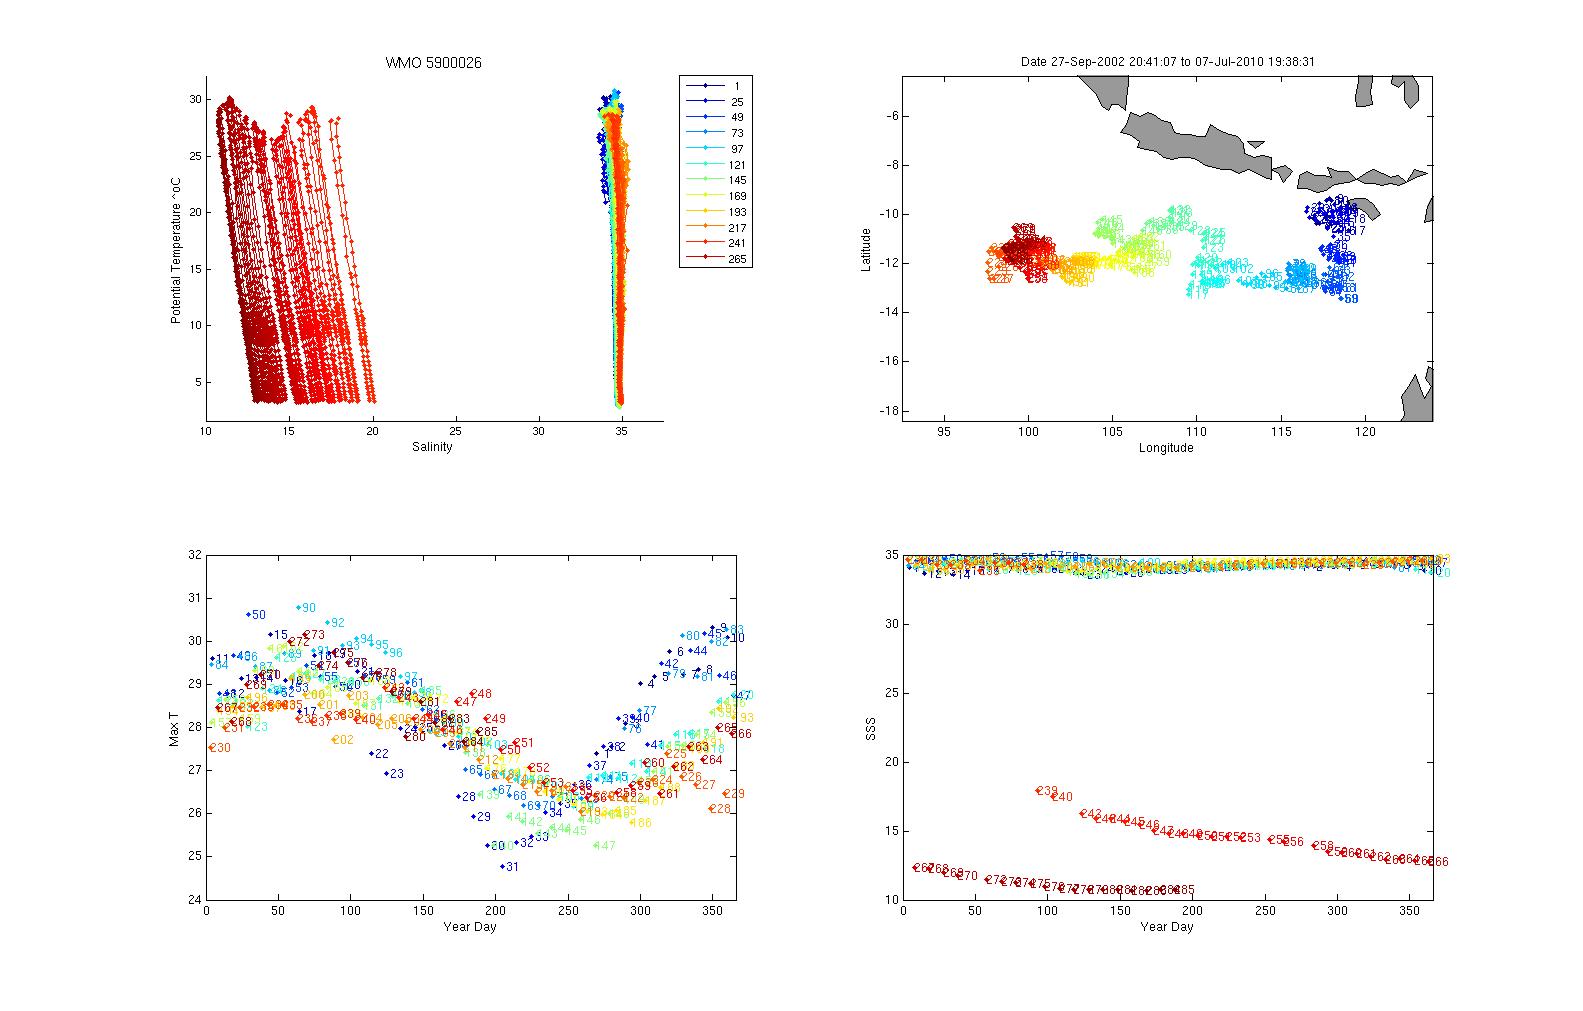
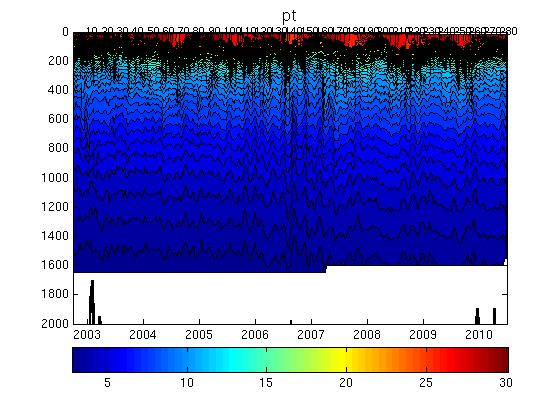
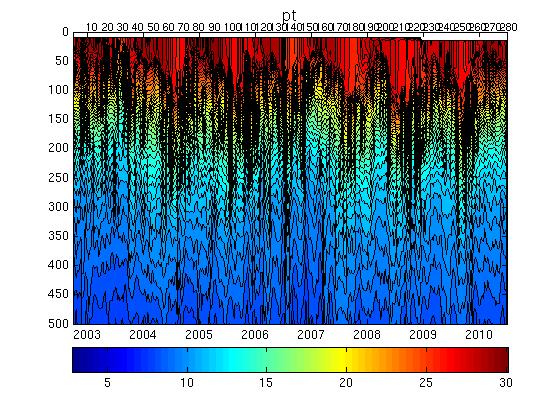
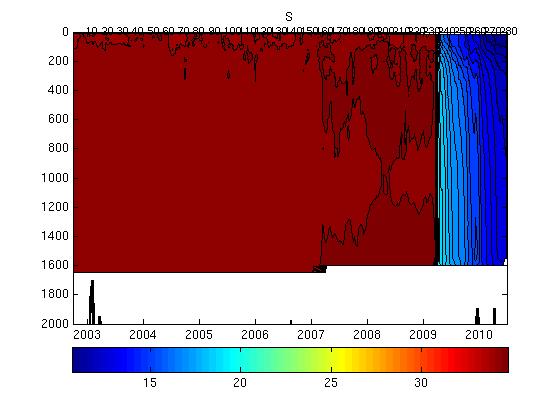
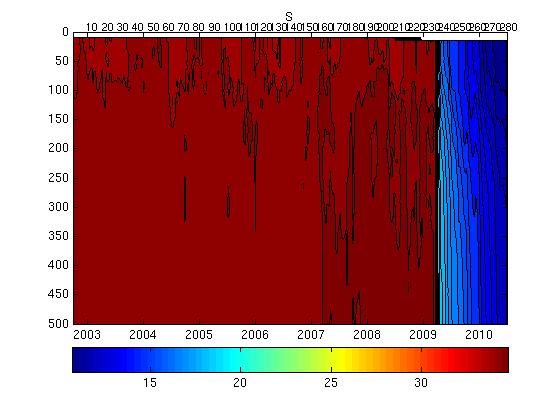
Potential Temperature-Salinity (a), Location (b, Max Temperature (c) and Sea Surface Salinity (d) plots located below.
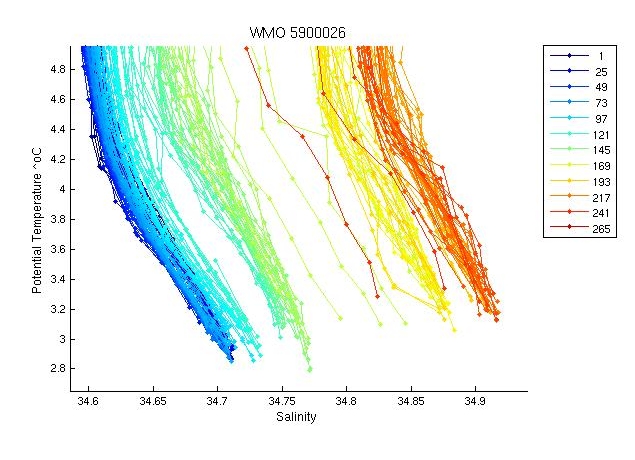
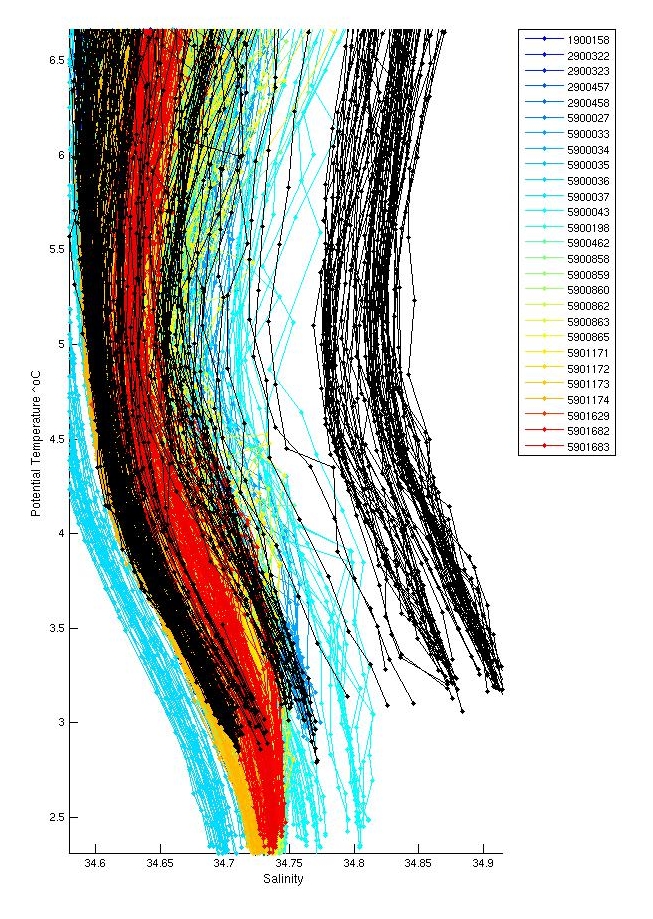
The plot below shows the potential-temperature/salinity relationship for the deepest theta levels where the relationship between the two parameters should show the least variation.
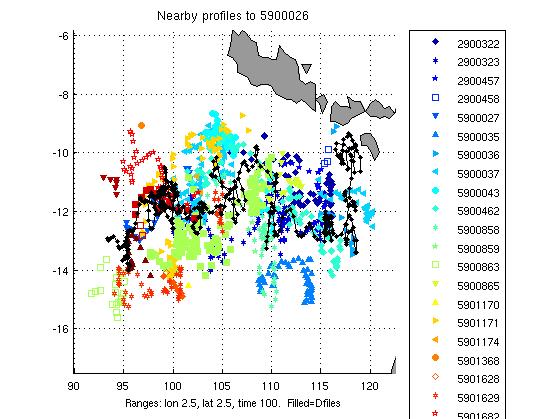
The two plots below show a). the location of this float (black circles) in relation to the position of other nearby argo floats (coloured circles) and b). The potential-temperature/salinity curve for this float (in black) compared to nearby argo floats (coloured).
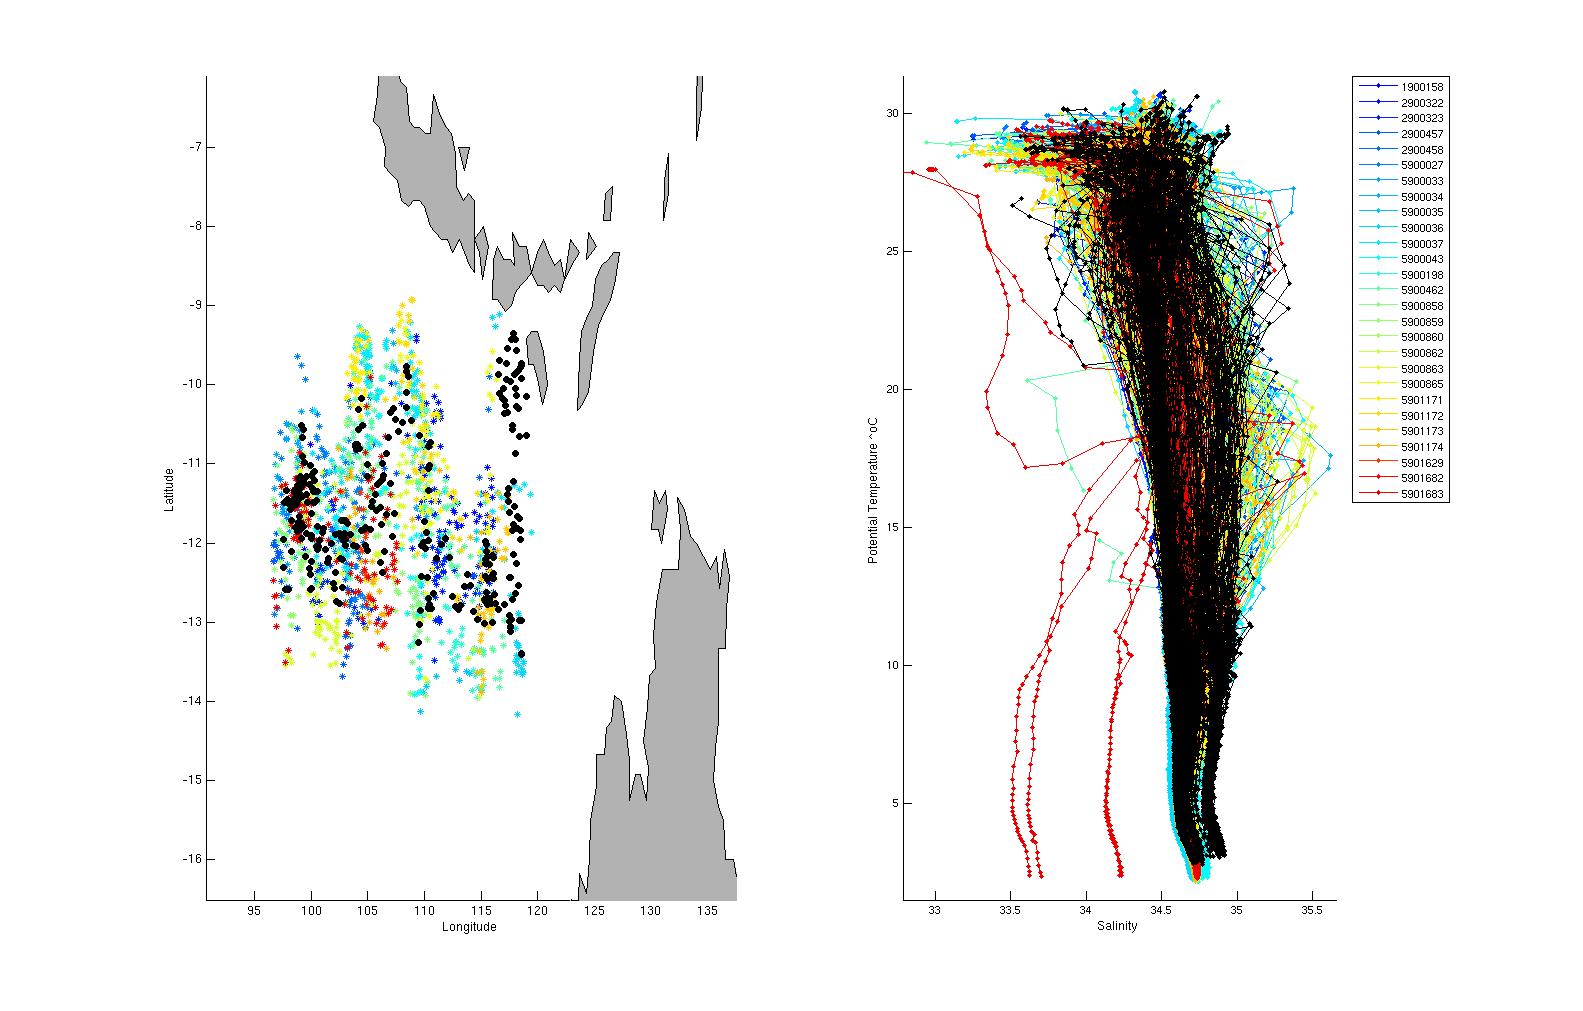
The potential-temperature/salinity relation for the deepest theta levels for this float (in black) and nearby argo floats (coloured) is displayed below.
There were inversions in profiles; 34,41,55,62,67,95,97,98,102,136,144,190,193,244,245,246,250,252,257,263,275,278,282. None of these were significant and therefore were not flagged.
Salt hooks were located in a few profiles and were flagged as QC 4 for both T & S.
A deep spike in salinity was flagged in pf 122. There was some missing data in profile 245 at 35 to 50 m. .
The plot below shows the analysis of salinity drift using the OW software.

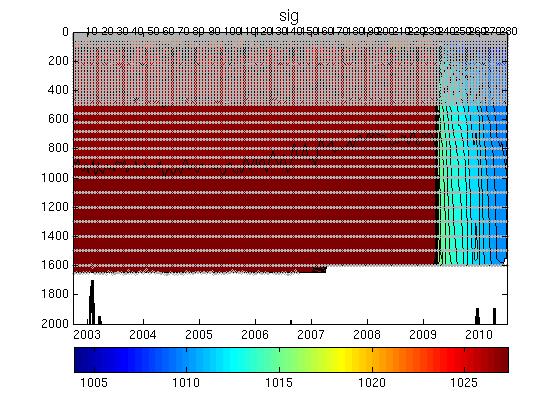
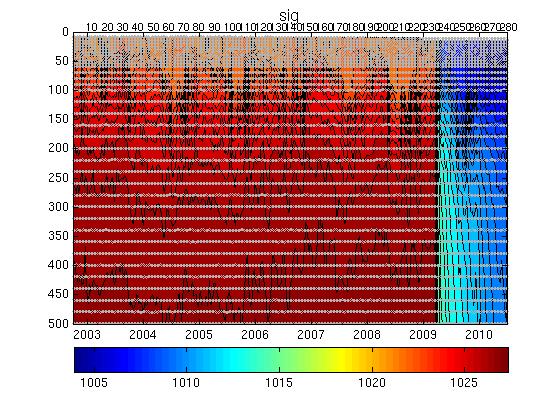
The four plots below show the salinity anomalies on theta surfaces compared to (a) the Gouretski and Kolterman climatology, (b) the CARS (CSIRO Atlas of Regional Seas)/WOA (World Ocean Atlas) climatology, (c) the anomalies within the float series itself, (i.e. the salinity anomaly of each profile from the mean profile average for the float and (d) the raw float salinity compared to the CARS and G&K climatological salinity on a deep theta surface.
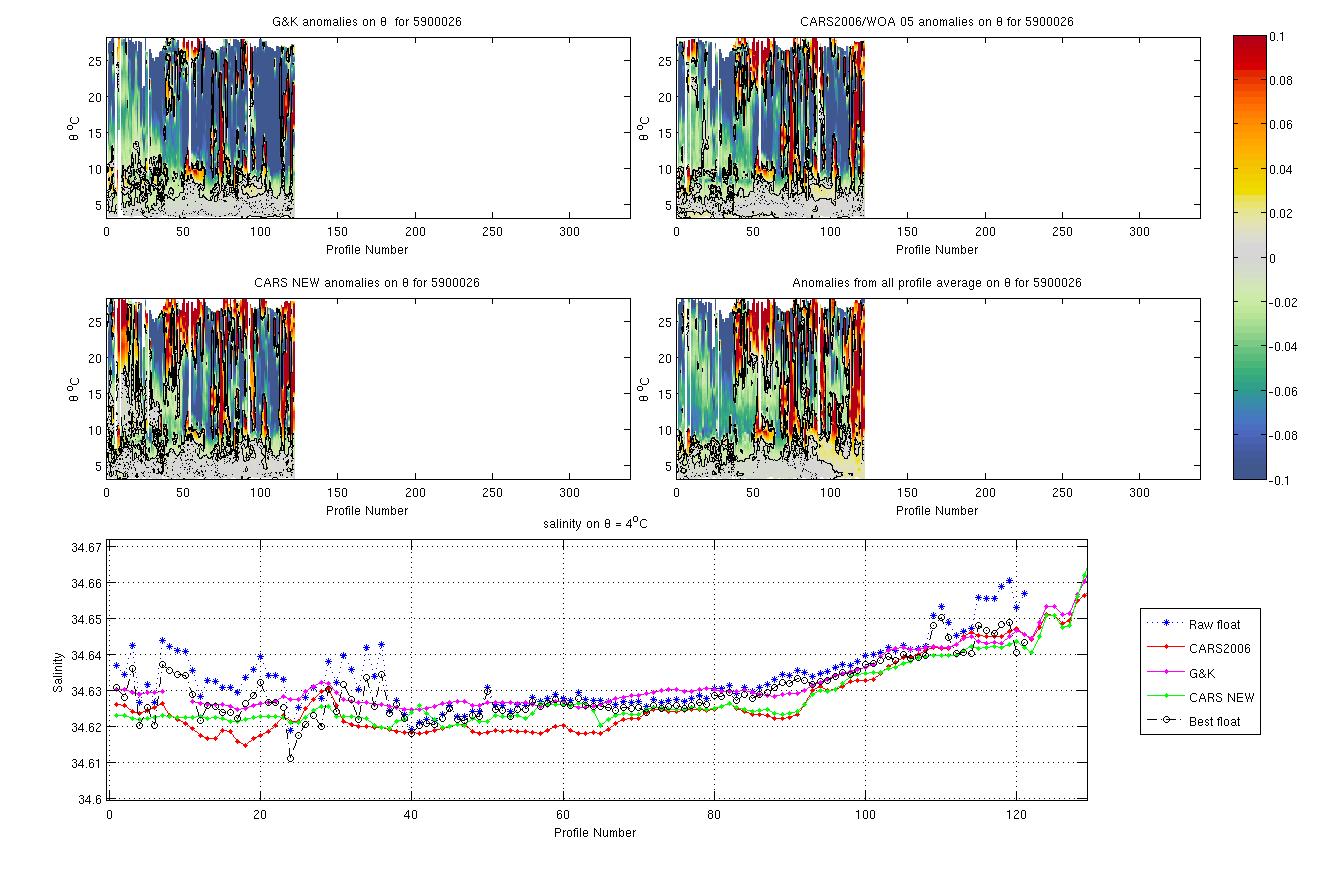
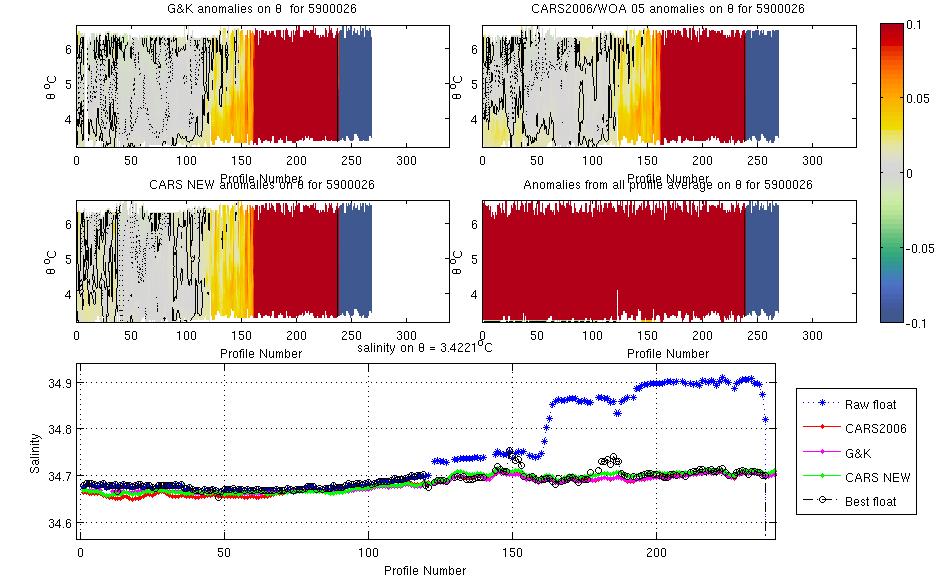
The anomaly plot shows that the float is salt offset from climatology by about 0.01 for profiles 1 to 114, then by 0.04 to pf 123 and then by 0.015 to 0.2 after that.
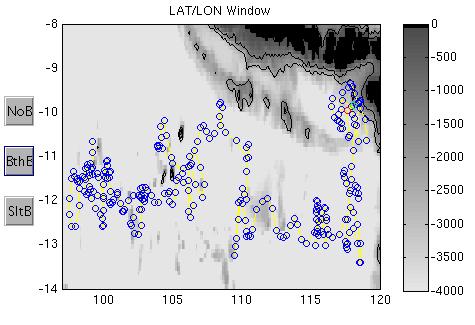
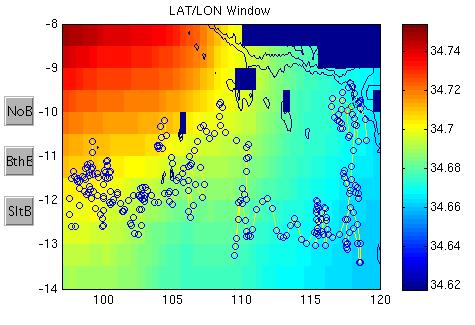
The plots below show the raw float salinity data (solid blue line) compared to neighbouring argo floats (coloured symbols) on a deep potential temperature surface. The locality map shows the location of the profiles for this float and for neighbouring floats.
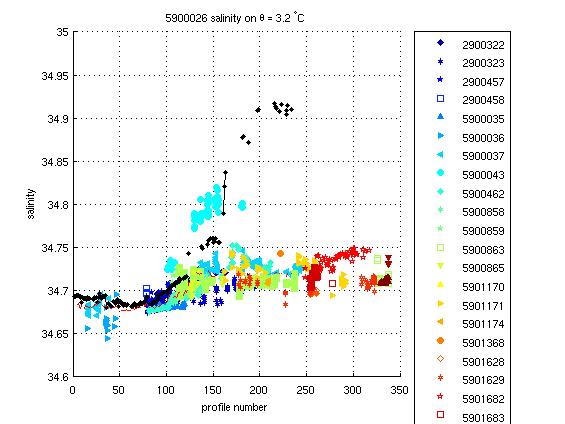
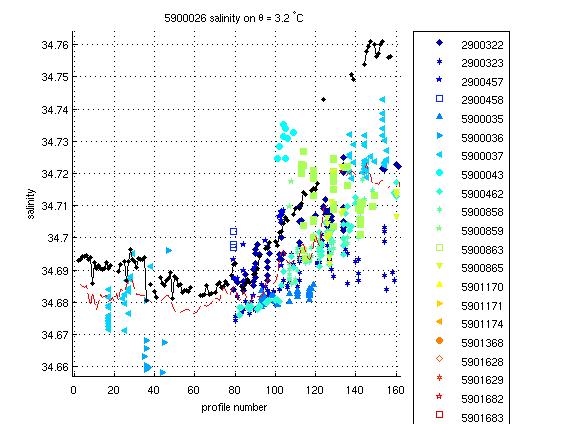
The float is at the upper end of the spectrum but well within range of other nearby floats for the first 114 profiles. It then obviously drifts and is salt offset. The comparison with nearby argo clearly shows that to pull the float back to climatology would make it too fresh compared to nearby floats. Therefore as it is within +- 0.01 we will not adjust and will review with OW later.
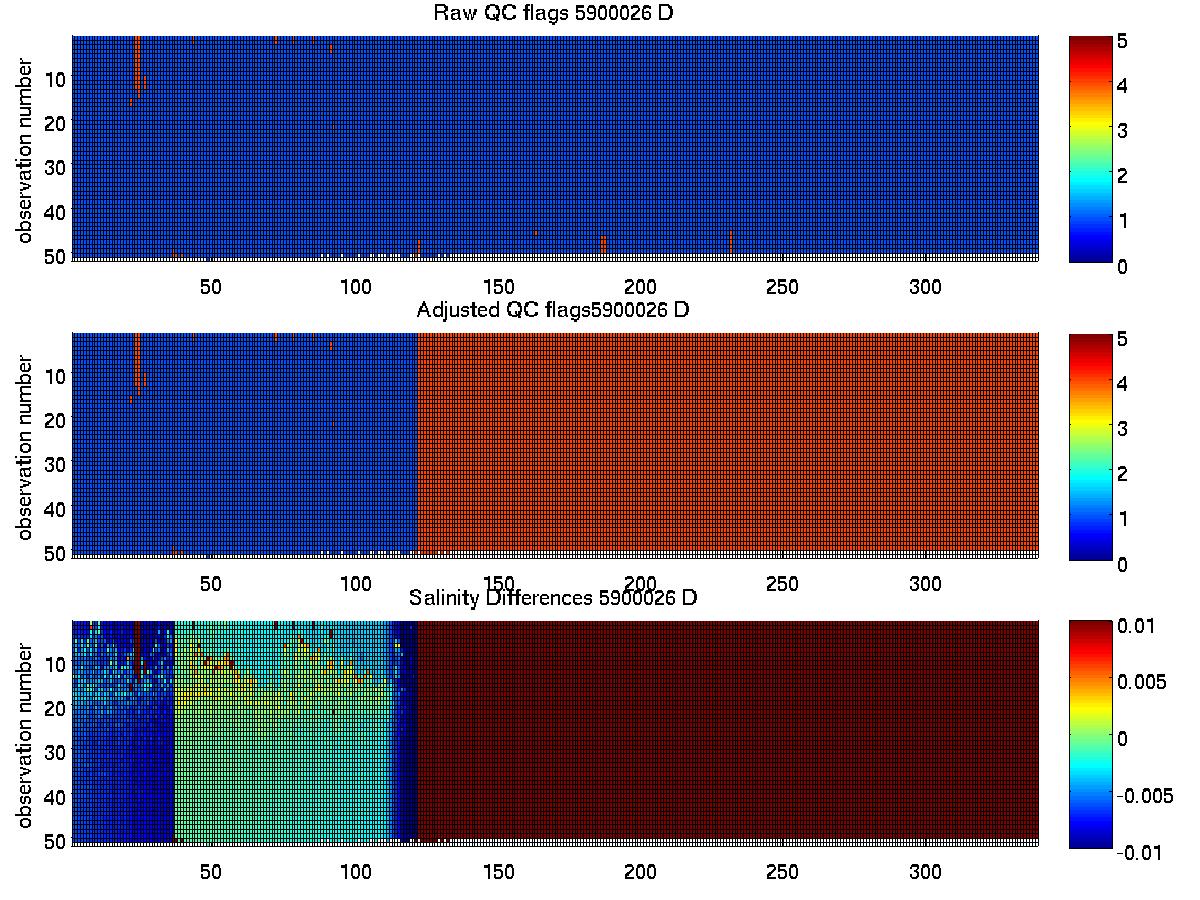
This float required no salinity drift correction for profiles 1 to 114, all subsequent profiles suffer from serious salinity drift and PSAL_ADJUSTED QC is set to 4.
The plot below summarises the QC flags and salinity differences for the raw and adjusted salinity fields in the final delayed mode files submitted to the GDAC.
Created 23-07-2010