The table below provides basic information about the float, including primary sensors, mission parameters and current status of profiles.
| Institute | CSIRO |
| Principal Investigator | Susan Wijffels |
| Pressure Sensor | PAINE 3000psia(serial number=189784) |
| CTD Sensor | PALACE-SBE-41 (serial number=123) |
| CTD Sampling Mode | Burst Sampler |
| Controller Board | |
| Additional Sensors/Software | None |
| Park Depth | 2000 m |
| Profile Depth | 2000 m |
| Launch Date | 12-10-2009 |
| Number of D-moded Profiles | 103 |
| Calibration Date | 02-09-2010 |
| Pressure Drift | Surface Pressure Offset corrected |
| Salinity Drift | No salinity drift detected |
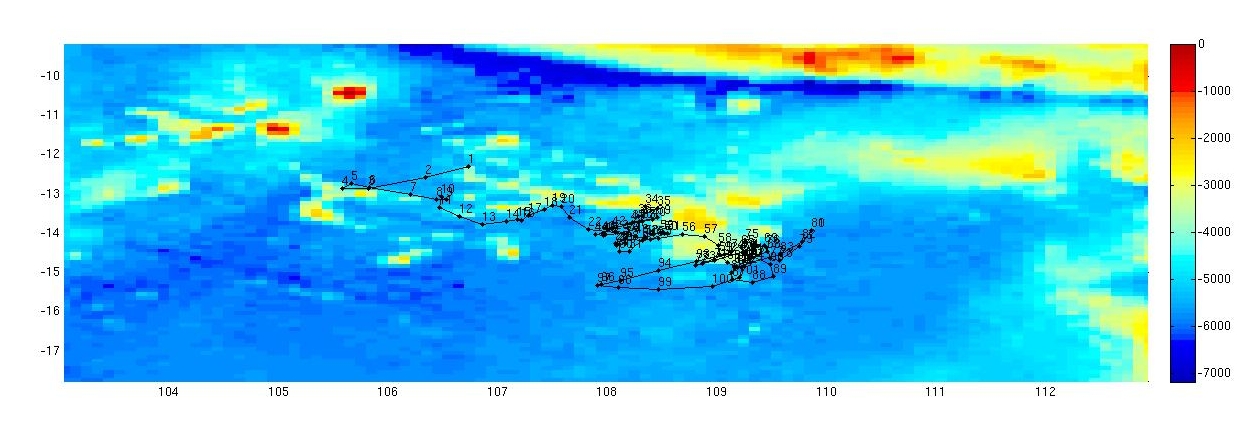
This float was located in the Indoensian throughflow, in an area bounded by 105 to 110 şE and 12 to 16 ş S.
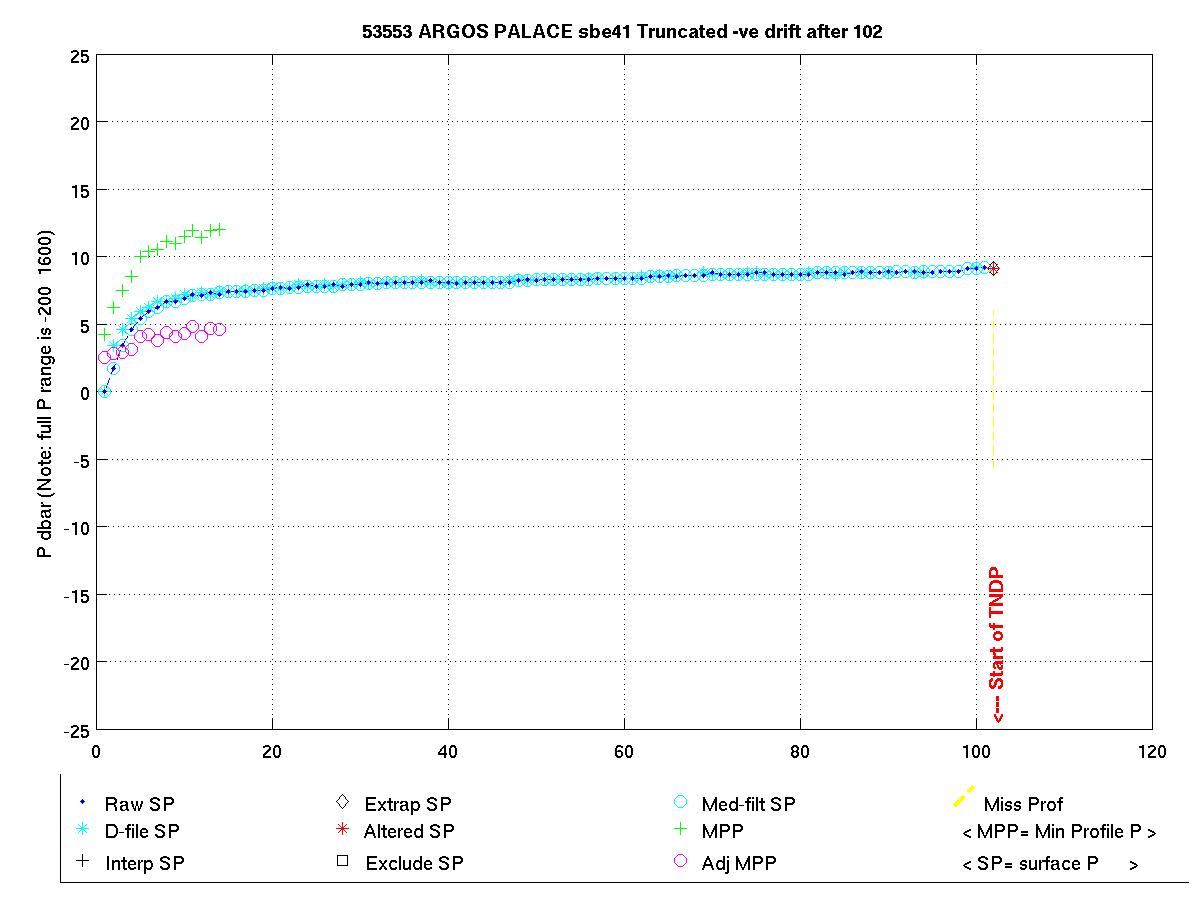
The surface pressure for this float is shown in the plot below.
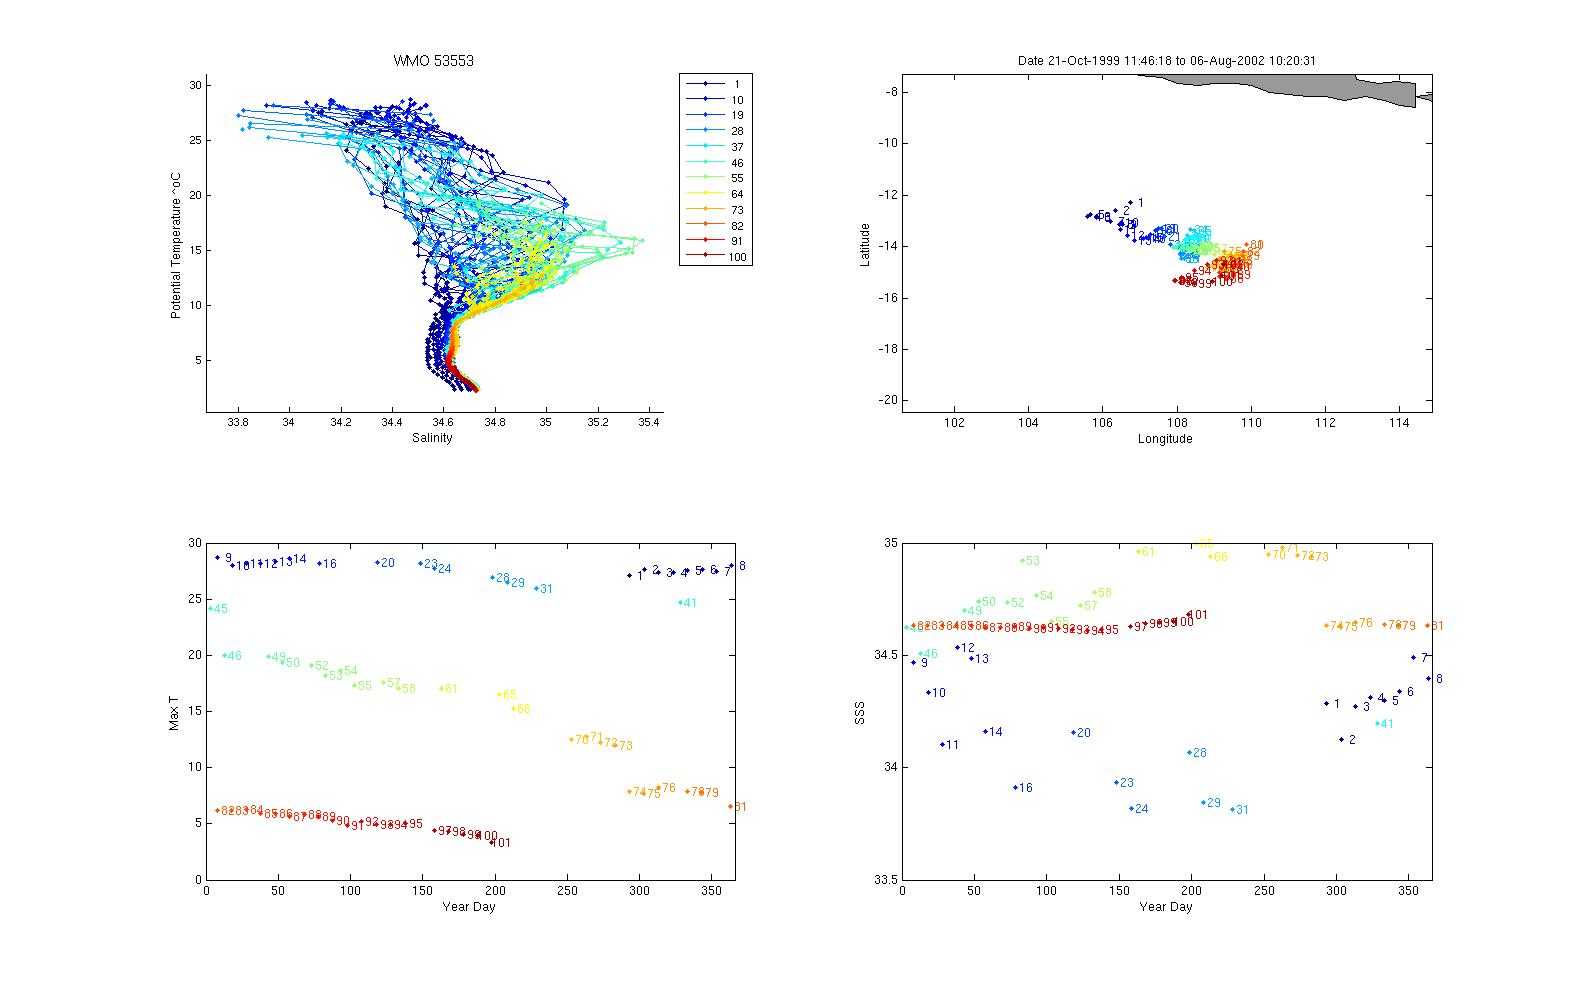
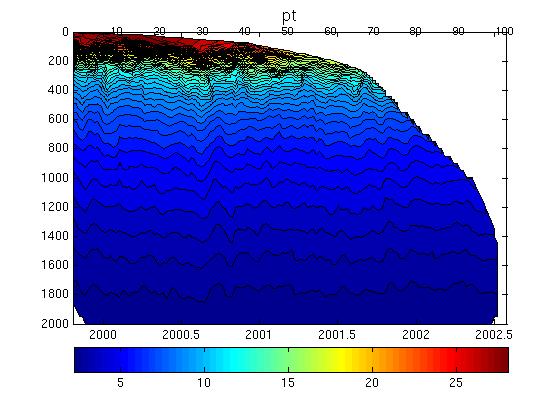
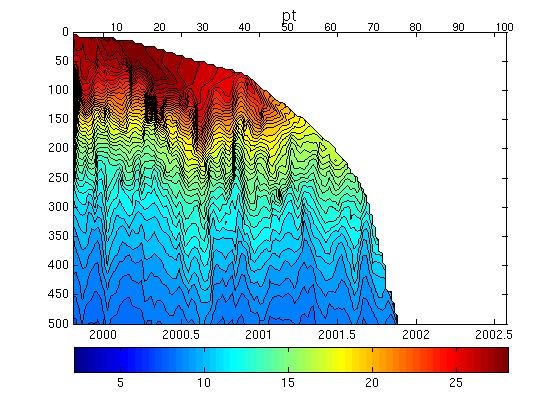
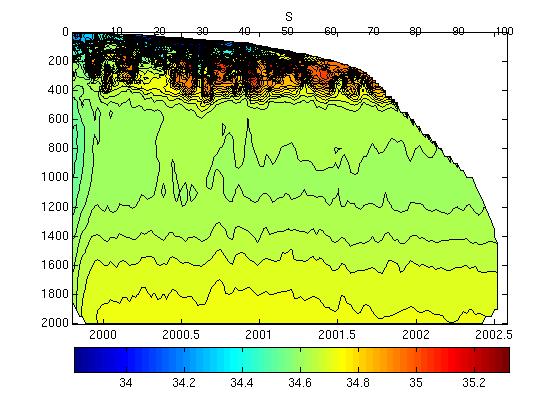
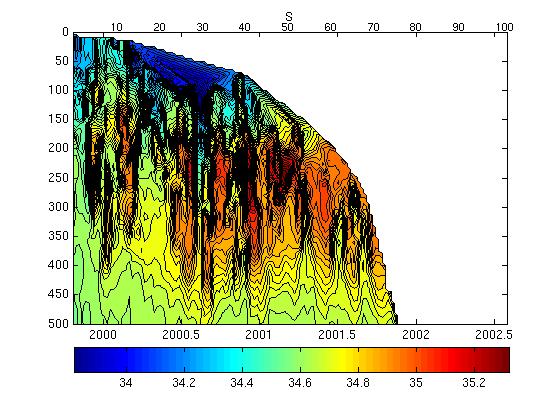
Potential Temperature-Salinity (a), Location (b, Max Temperature (c) and Sea Surface Salinity (d) plots located below.
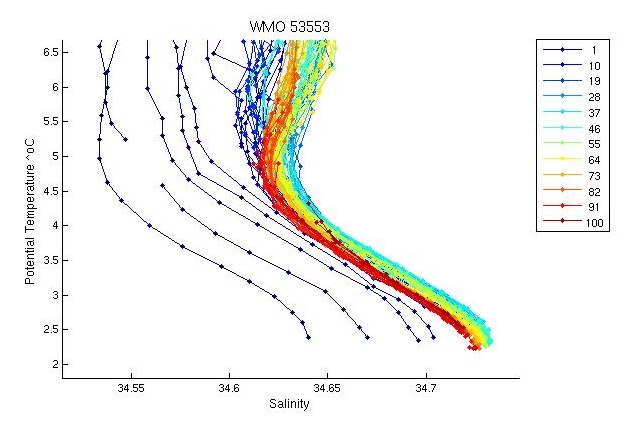
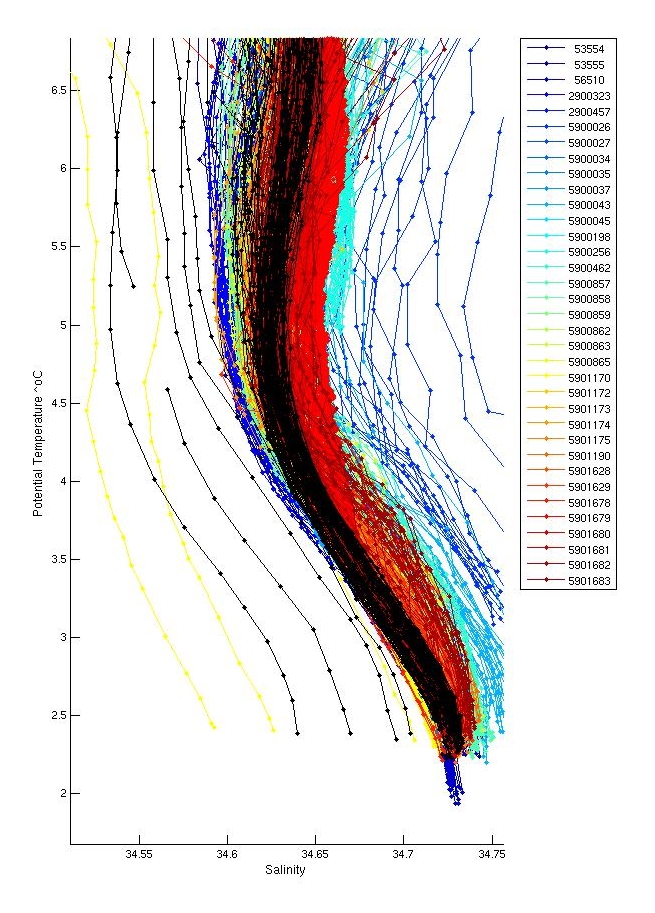
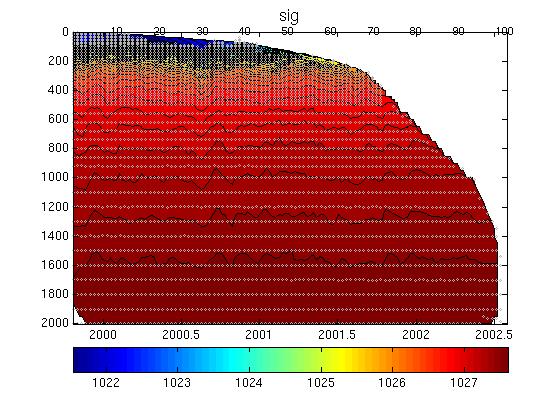
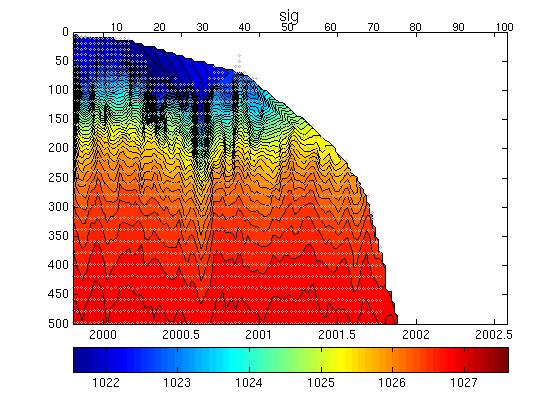
The plot below shows the potential-temperature/salinity relationship for the deepest theta levels where the relationship between the two parameters should show the least variation.
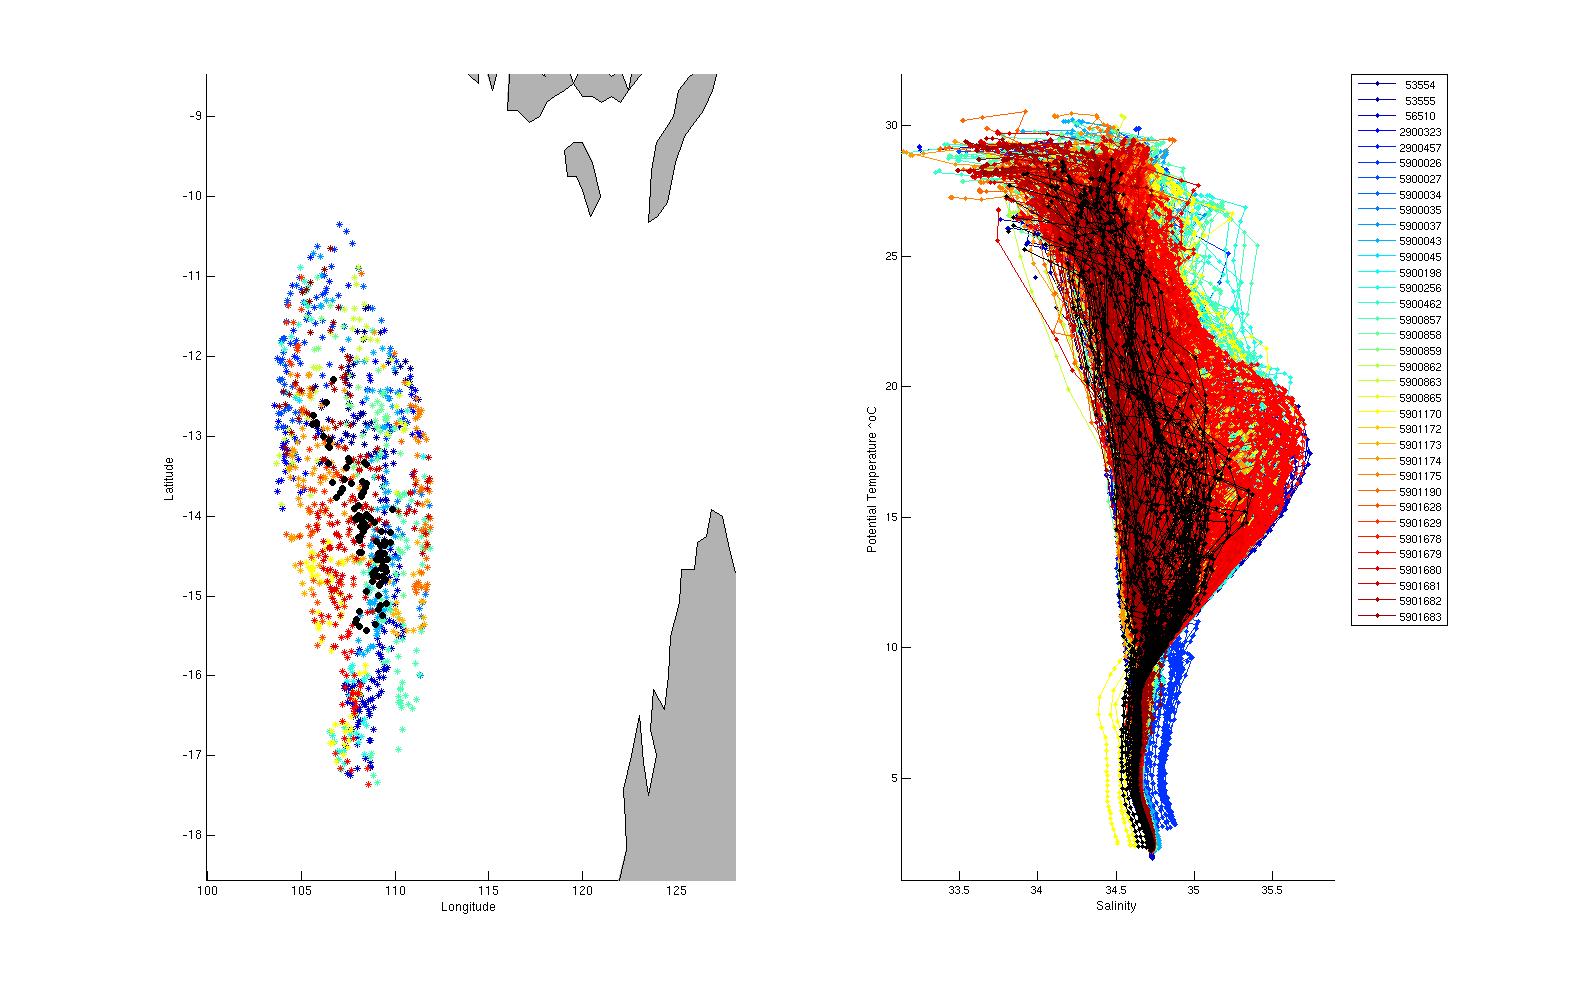
The two plots below show a). the location of this float (black circles) in relation to the position of other nearby argo floats (coloured circles) and b). The potential-temperature/salinity curve for this float (in black) compared to nearby argo floats (coloured).
The potential-temperature/salinity relation for the deepest theta levels for this float (in black) and nearby argo floats (coloured) is displayed below.
There were inversions in profiles; 2. None of these were significant and therefore were not flagged.
Salt hooks were located in profiles; 1,2,3,4,5,6,7,8,9,10,11,12,13,14,15,16,17,18,19,20,21,22,23,24,25,26,27,28,29,30,31,32,33,34,35,36,37,38,39,40,41,42,43,44,45,46,47,48,49,50,51,52,53,54,55,56,57,58,59,60,61,62,63,64,65,66,67,68,69,70,71,72,73,74,75,76,77, 78,79,80,81,82,83,84,85,86,87,88,89,90,91,92,93,94,95. These were flagged as QC 4 for both T & S.
A few near bottom values were flagged as QC4.
The plot below shows the analysis of salinity drift using the OW software.

The four plots below show the salinity anomalies on theta surfaces compared to (a) the Gouretski and Kolterman climatology, (b) the CARS (CSIRO Atlas of Regional Seas)/WOA (World Ocean Atlas) climatology, (c) the anomalies within the float series itself, (i.e. the salinity anomaly of each profile from the mean profile average for the float and (d) the raw float salinity compared to the CARS and G&K climatological salinity on a deep theta surface.
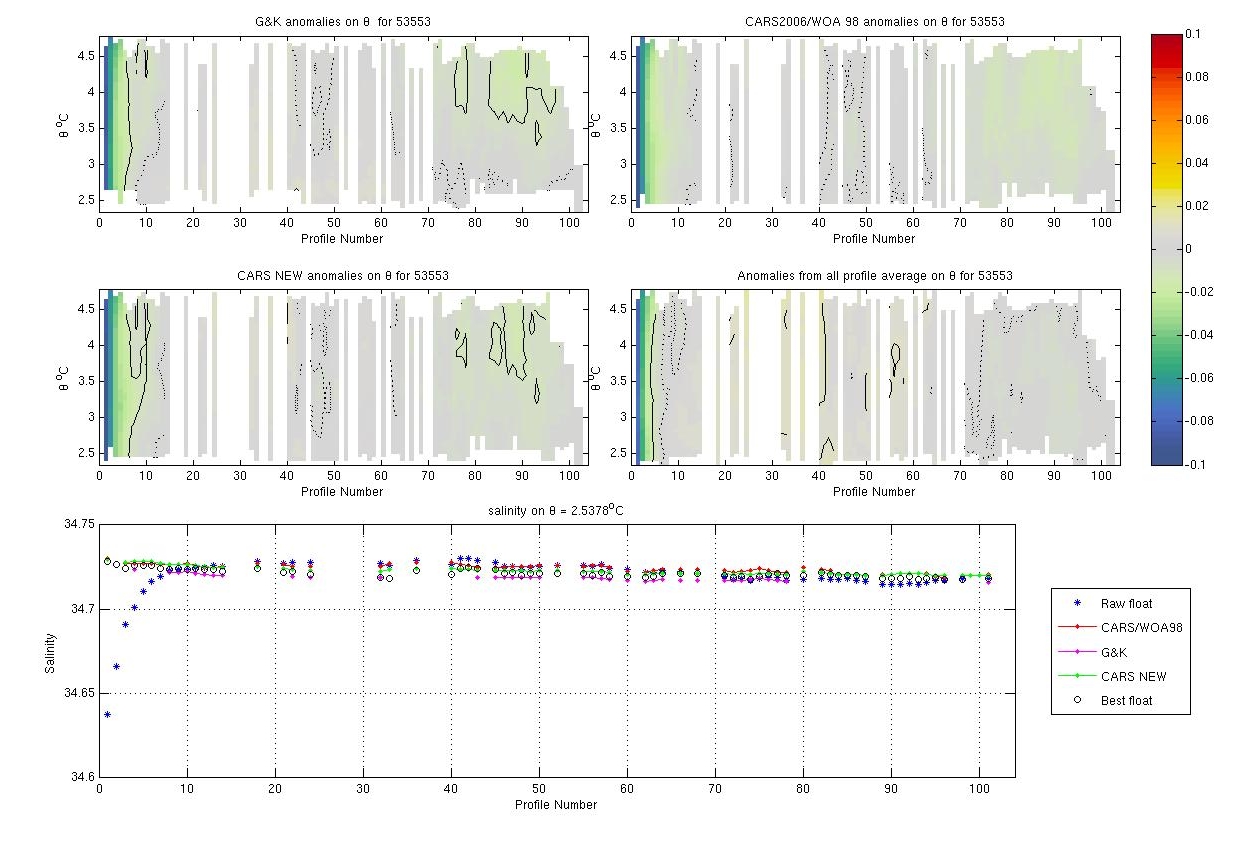
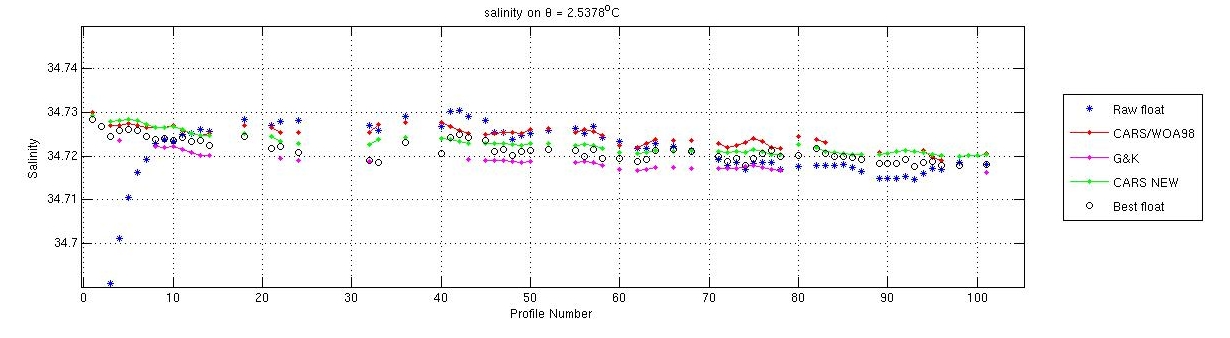
Apart from severe TBTO for the first 7 profiles, this float is close to climatologies, no drift.
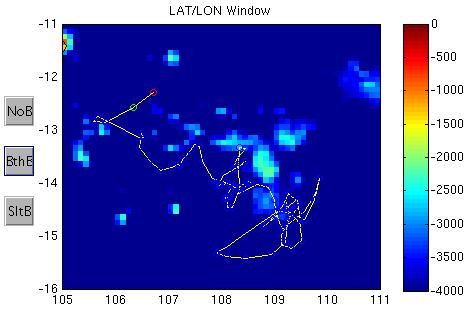
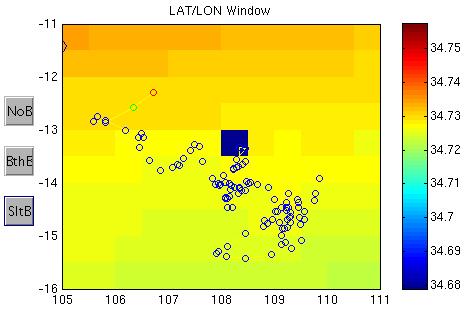
The plots below show the raw float salinity data (solid blue line) compared to neighbouring argo floats (coloured symbols) on a deep potential temperature surface. The locality map shows the location of the profiles for this float and for neighbouring floats.
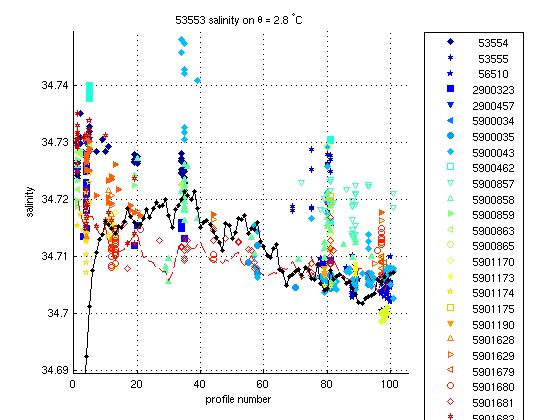
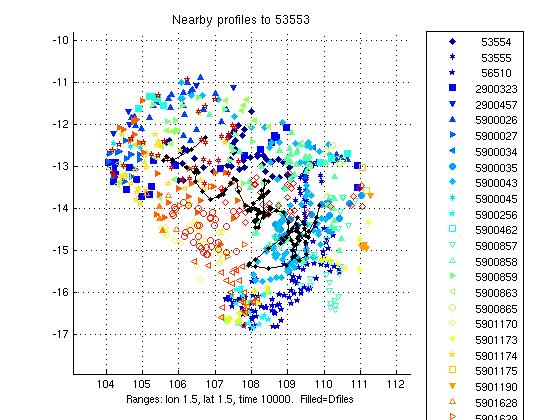
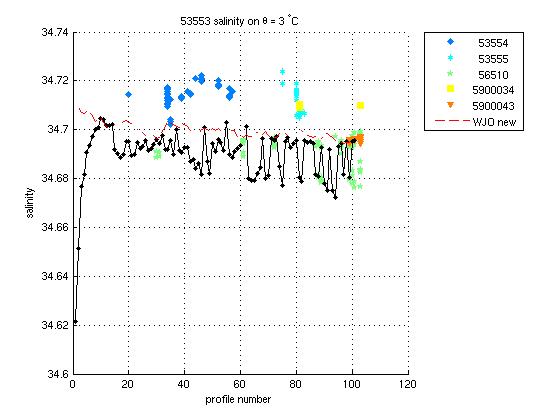
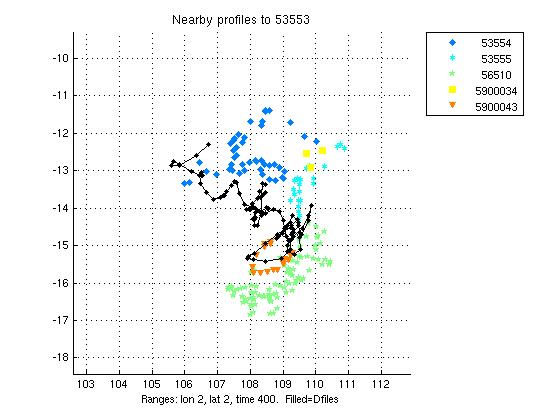
Apart from TBTO, this float is reasonable compared to other argo floats.
This float required TBTO correction for profiles 1 to 7, otherwise no salinity drift correction.
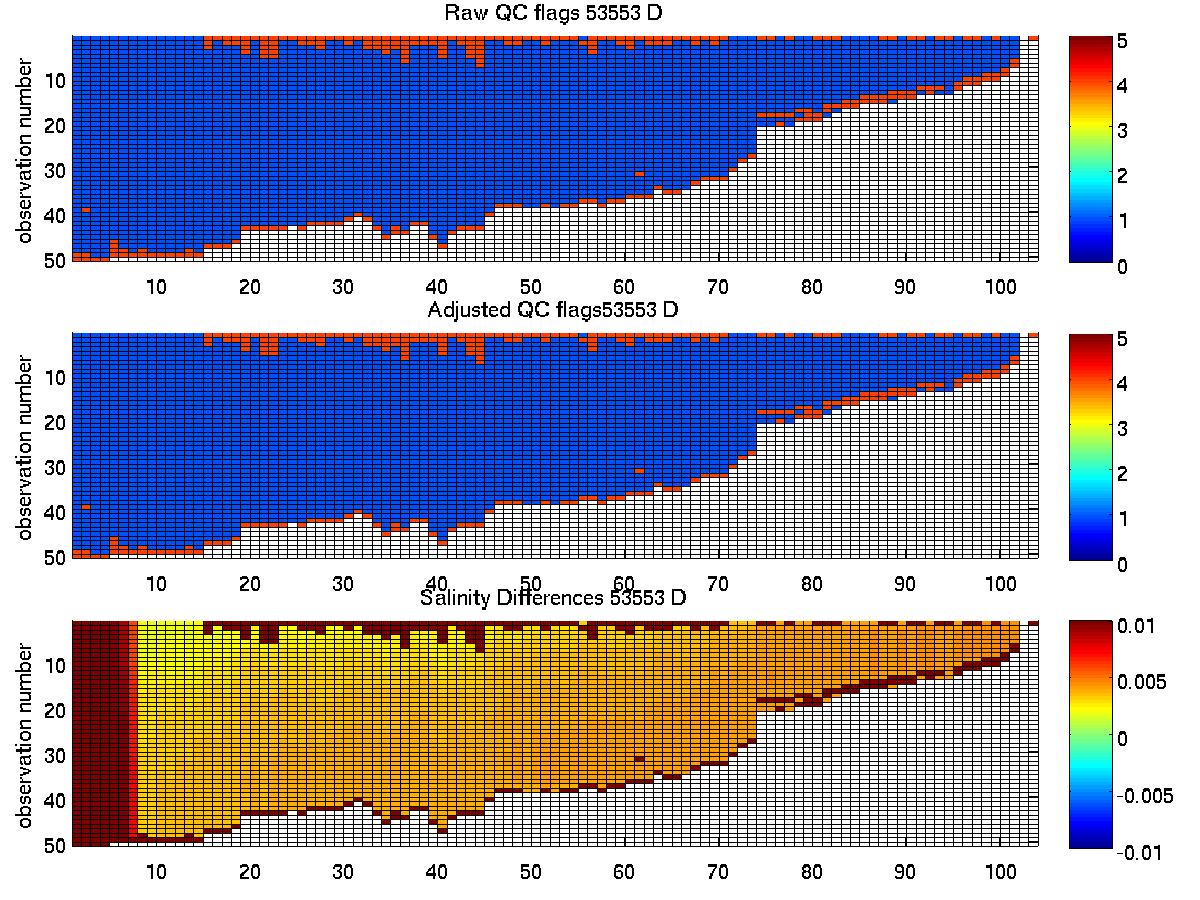
The plot below summarises the QC flags and salinity differences for the raw and adjusted salinity fields in the final delayed mode files submitted to the GDAC.
Created 02-09-2010